
The national median rent on newly tenanted homes increased by $25 a week last year, although rents in Auckland went against the trend and were unchanged.
The latest bond data from the Ministry of Business Innovation and Employment shows bonds were received for 35,115 residential properties across the entire country in the fourth quarter of last year, most of which would have been for new tenancies.
The median rent for those tenancies was $550 a week, up by $25 a week (4.5%) compared to the fourth quarter (Q4) of 2021.
Interest.co.nz collates the data by all main urban districts and by the main rental property types - one and two bedroom apartments/units and three bedroom houses.
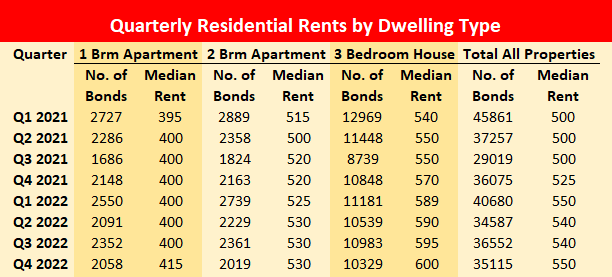
The first table below shows the median rent for each of those dwelling types from Q1 2021 to Q4 2022.
Over the 12 months from Q4 2021 to Q4 2022, the biggest increase by property type nationally was for three bedroom houses, up by $30 a week to $600, followed by one bedroom apartments/units up by $15 a week to $415 and two bedroom apartment/units up by $10 a week to $530.
Interest.co.nz considers the data collected from tenancy bonds to be the most important indicator of rental movements because it is based on the actual rents agreed between tenants and landlords rather than advertised rents, which may or may not be achieved, and because new tenancies generally set the rent benchmarks for existing tenancies when their rents come up for review.
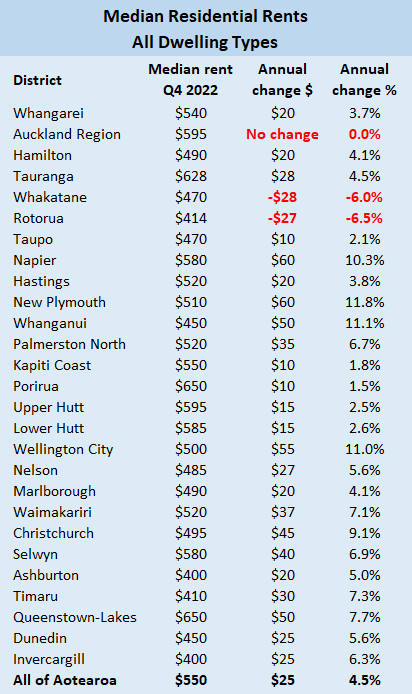
While the national median rent was up by $25 a week last year, there were some big regional differences.
The heftiest increase was a tie between Napier and New Plymouth which both posted increases of $60 a week, followed by Wellington City $55, Whanganui $50 and Queenstown-Lakes also $50.
In the wider Wellington region rent increases were more subdued outside of the central city, with median rents in Kapiti, Porirua, and the Hutt Valley rising by between $10 and $15 a week.
The second table below shows the annual movement in rent in most major urban centres.
The median rent of $595 a week in the Auckland region is notable because it is unchanged from Q4 2021, however there were significant differences in rental trends within the districts that make up the Auckland region, with some of the most expensive parts of the city posting declining or static median rents in Q4 2022 compared to a year earlier.
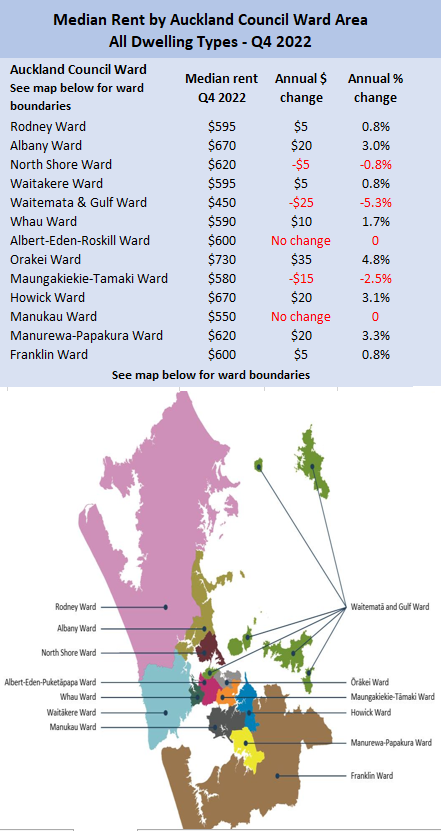
Interrest.co.nz compiles the Auckland district figures by council ward areas, and the North Shore Ward, Waitemata and Gulf Ward and Maungakiekie-Tamaki wards all posted declines in their median rents for Q4 2022, compared to a year earlier, while median rents in the Albert-Eden-Roskill and Manukau wards were unchanged in that period.
The final table below shows the median rent figures for all Auckland Council wards and a map showing the ward locations.
The comment stream on this story is now closed.
- You can have articles like this delivered directly to your inbox via our free Property Newsletter. We send it out 3-5 times a week with all of our property-related news, including auction results, interest rate movements and market commentary and analysis. To start receiving them, register here (it's free) and when approved you can select any of our free email newsletters.
53 Comments
Should be good for maintaining low inflation... nope it didn't.
Usually it's a trailing component. Incomes go up first, more money chasing the same amount of rentals, rents then go up. Except in most markets where cookie cutter townhouses aren't being mass-produced rentals are declining, due to the shift to CHPs, AirBNB and sell downs.
What's this as a percentage of disposable income?
Obviously Auckland landlords are masochists. They are enjoying the bondage and discipline and don't want to sell out ... yet. Long may it last for tenants, they are paying a smaller and smaller proportion of their household income in rent.
Property owners pay higher and higher rates, mortgage interest, serviceman costs, income taxes and upgrades to be compliant. Those auckland landlords are a nice bunch haha
Oh I forgot to mention, insurance premiums doubling.
Maybe Auckland landlords are an example of how the market sets the rent price, not the landlord's costs.
Exactly. And there has been a huge surge in supply over the last two years, and until late last year negative population growth.
supply and demand….
"The times, they are a changing maybe"
Bob Dylan
Whatever our accrued inflation numbers are over this rough patch, that is what our accrued rental inflation numbers will look like 24 months after the fact.
Accentuated in this instance by rental owners who sell not being replaced by rental owners, building boom finished, and now tragically lots of displaced families from the east side of the NI. Plus insurance premiums are about to go through the roof.
Apply your own level of moral outrage, but this is what will happen. I'll take the over on any bets.
Agree rents will go through the roof. The British are a couple of years ahead with their version lite of our non tax deductibility of interest. From memory rents went up about 17 percent p.a. , not just in London. It’s coming folks, unless of course the rules are changed.
When a rental owner sells and removes a house from the pool of rentals. That house becomes a home to a former renter, also reducing the demand by an equal amount.
Rent is set by the market, not by landlord expenses.
The new build apartment market is now dead in the water in Auckland due to escalating costs and falling prices. And I mean dead. Some supply to still come on line due to the long build times involved, but once immigration and student visas return to semi normal, rents will skyrocket. This will take years to play out. The numbers for building new houses / town houses/ apartments just don’t stack up. There’s Lots more to this subject than a few lines in a comment section permits. Build to rent is also financially questionable, talk to the people doing it. At the heart of the coming rental problem is really bad fiscal management and terrible tax policy. The government can never build enough to keep up, look at Kiwi build. KO are helping people buy new houses that can’t really afford it, but that’s another issue. It’s not as simple as thinking if a landlord sells, a new person buys it and rents are not set by landlords costs. It’s a much bigger game of rising demand and falling supply in the years ahead.
The owners paid $2.3 million for the St George St home in Papatoetoe in December 2021 but yesterday resold it at auction for $1.305m..... is unsure why the owners paid $2.3m for the house in 2021 when its council valuation was $1.425m at the time. A real estate agent connected with the recent sale said they could not comment.
Sounds like good use of the New Zealand Property Market Laundry to me. Someone got their $2.3m freshly washed in 2021 and one way or another $1.3m has gone through the same channel. Only speculation, (pun there!) of course....
Sounds like someone thought they could develop something, then either the numbers or the council wouldn't allow it.
Yes, developers buying land in Papatoetoe was at frenzy levels in 2020 and 2021. Silly prices like that were often being paid, although that is probably one of the more absurd examples.
Just checked, the site is within a ‘flood sensitive’ area. So even more reason they ridiculously overpaid, especially with recent events.
The same thing happening out in West Auckland too. Are these new development houses selling currently? Sometimes there are 11 units on an 800sqm section. Who buys those? Also who is buying the more expensive 1.5 - 2.0M apartment-like houses being built on sections in the central city?
I can't help feeling some sort of day of reckoning is coming. I do tend to be pessimistic though.
I wonder why there was a mortgage registered against the property in June 2022?
perhaps the owner had an unsecured debt to family privately, by securing the mortgage that family member steps ahead of other creditors if things fall over..... just sayin, don't know any details
Perhaps. Plenty of examples of just plain dumb decisions likely due to FOMO
Another recent example comes to mind - 29 Wheturangi Rd, greenlane, sold for just over $3M with the then CV of $1.6M in Oct 21.
Sold this month - not sure on final price but had been advertised with a asking price of $2.3M after having been passed in at auction.
The RV for that Wheturangi Rd house was 2.4M in 2021. Houses were regularly selling well over RV in 2021-22. Will be interesting to find out what it sold for recently.
is unsure why the owners paid $2.3m
If you watch the auction linked to in the NZ Herald you will see that the vendors didn't agree to put the house "on the market" until bidding reached 2.3M so it wasn't one of those frenzied auctions I recall where a property reached 500k- 1M more after going on the market.
Does look suspicious. Sometimes sales are interrelated, where a property is sold to themselves to get the price up and extract a bigger mortgage out of the banks, it’s called ramping and mortgage fraud. Not saying it’s the case here. But an 80 percent mortgage on 2.3m is attractive to some.
Especially if you can fly out of the country with your gains never to return again, leaving the bank to tidy up the mess.
In this market defined by capital loss, rental yields now mean little. Look at Wellington for example. Rents are up 11% yet house prices are down 20%. Rental yields are starting to reflect the risk that should have formed the basis of a sound investment strategy all along. The many red flags were ignored 🚩🚩🚩 Time to pay the Piper? Its abhorrent that Spruikers are out there telling FHB's to buy now.
... January ... poor weather ...
Hi tenant here is the notice of rent increase
Hi landlord I cannot afford that
You know what to do tenant. Bye now
..and then the place stands empty for weeks and months while the rental agent unsuccessfully tries to find a new tenant..
Buying a home and getting rid of the landlord is one of the best things a person can do
Tell the landlord Bye now 🙋♂️ and watch his or her face when he realises he should have kept the rent cheap
Remember that overpaying is dead money, that you have to pay back.....
Dont Overpay
Spruikers boast how they timed the market for gains and were "blessed". FHB's have the right to time the market and gain from the inevitable losses.
It depends if you value quality of life from interfering landlords who keep sending letters to tell you the most inane instructions... where to park, how many cars you are allowed, what and how to clean.
On a positive note, in the course of time the paranoid Landlords you speak of will leave the game through natural attrition. After all, they are in the game for all the wrong and outdated reasons.
The REA is much more strict, staying on the tenants case.
“Tell the landlord Bye now 🙋♂️ and watch his or her face when he realises he should have kept the rent cheap”
Although in many cases it is a relief for the landlord they can finally put the rent up to market rate.
Hi Landlord, here is the bond data that suggests I don't need to do that. Suck it up, buttercup!
Give him a smile and tell him the bad news
Rent review notice: Due to recent legislation changes and increasing cost …the weekly rent will increase …effective on….
Tenant: updates automatic payment
How kind of the tenant to update their automatic payment so they can keep on paying for the privilege of living in a property that ha increased massively in price! It's almost as if they enjoy being taken advantage of. All going well one day soon they may be able to purchase a home instead of lining the pockets of greedy landlords like you who don't care about their well-being .
In my long and illustrious renting career, I have always only rented from older, potentially debt free landlords. Always direct, never through a property mangler.
In the last 10 years with 3 different properties, I have had the sum total of 1 rent increase during a tenancy. (auckland based)
Dont rent from Johnny come lately.
I wonder what the contribution of rent rises are to our overall CPI rises? For example, had rent rises remained at the level of the 2% target, and all other rises/falls had stayed the same - I wonder what difference that would have made to the headline inflation figure the RBNZ is working with at the moment?
OCR rises have exactly the opposite effect on rent rises (i.e., they are inflationary in that regard).
And I assume, the above stats, if based on bond data, don't take into account any rent rises for emergency and/or transition housing rent costs over the period.
I really have lost confidence in the shallow sort of analysis/commentary out of the RBNZ at the moment.
I know this sounds crap but hear me out.
Compound interest has been referred to as the 8th wonder of the world. Is paying rent the 9th.
It's the gift that keeps giving, until you finally expire.
HW2, it doesn't sound like crap at all. Albert Einstein is credited with the quote, "Compound interest is the eighth wonder of the world”. He who understands it, earns it...he who doesn't, pays it."
I really worry for those old ladies who are renting. They have little savings if any and they have to watch every penny. For them they have no compound interest like you, just rent anxiety and how much the rent will be increasing or when the landlord sells where they will go.
Then I realise that they were young once and they made their choices.
NB: When we had little old lady tenants we made their lives comfortable and happy. Lowish rents. When we sold, the new owners made us multi millionaires, so I think it was all worth it.
I am the ghost of Christmas past …,,
Find another haunt, if there are any available
Unbelievable 😆
Yes unbelievable
... so ... all the excessive methods used by Ardern & Robbo to kick the snot out of landlords and to slow rent rises have done ... absolutely nothing !
Most incompetent government ever , utterly useless , completely stupid ...
Not in Auckland. CPI is at 10%. Rent increases at 0%. In essence rents have fallen 10% in Auckland.
In Australia, they are making a big deal of the increasing interest rates causing rents to rise. Rents over there are rising a lot. But that narrative isn't really occurring in NZ. Although it must be having an effect, as interest rates have risen a lot more in NZ.
I think they're pumping migration harder. Must've been Brock's spruiking.
Economists from Westpac Business Bank expect advertised rents to increase by a further 11.5 per cent in 2023, on top of the 10 per cent rise recorded to 2022. If this forecast is realised, it would be the sharpest annual increase on record.
Now borders are open, including in China, and the inflow of migrants and international students is gathering pace, putting further strain on an already tight market.
We welcome your comments below. If you are not already registered, please register to comment
Remember we welcome robust, respectful and insightful debate. We don't welcome abusive or defamatory comments and will de-register those repeatedly making such comments. Our current comment policy is here.