
After Covid-19 struck in early 2020, the Australian and New Zealand residential property markets both experienced a short dip followed by a dramatic rise, and then a falling away again. The trajectories were similar, but the movements were more pronounced in NZ’s case.
Since 2023, the two markets have diverged with house prices in Australia rising strongly while those in NZ have largely stagnated. There are likely numerous reasons for the divergence including a kiwi cash rate sitting 1.15% higher than its Aussie counterpart and a relatively weaker kiwi economy.
Last week the Assistant Governor (Economic) of the Reserve Bank of Australia, Sarah Hunter, gave a speech entitled ‘Housing Market Cycles and Fundamentals’. It’s useful in explaining fluctuations in Australian house prices since 2020 and it sheds light on the supply and demand factors that will influence the market in the immediate future.
Many of those factors are relevant to the NZ market.
Hunter makes the important point that the underlying demand for housing ‘is fundamentally determined by the size of our population and the number of people that live (on average) in each dwelling’.
Much current analysis on both sides of the Tasman focuses solely on the population component. High net overseas migration is blamed for putting upward pressure on house prices. Just last week the Leader of the Opposition in Australia, Peter Dutton, promised to address the ‘housing crisis’ by slashing migration. He claims this will ‘free up’ 40,000 homes in the first year and 100,000 homes over five years.
Much less attention is given to the second demographic component of demand for housing, namely average household size. However, Assistant Governor Hunter’s speech highlights its impact.
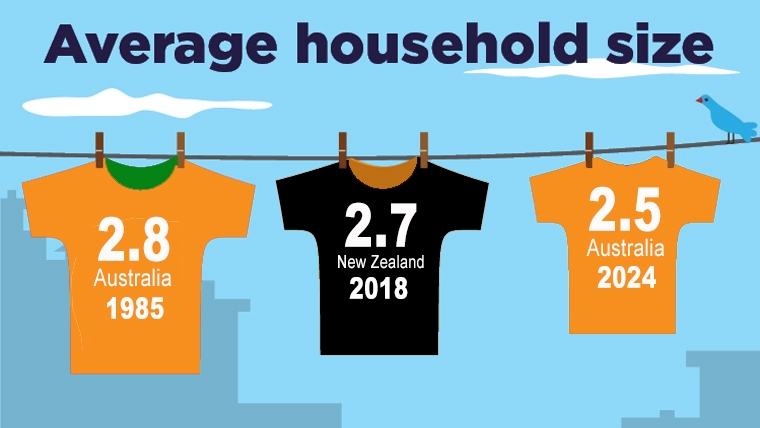
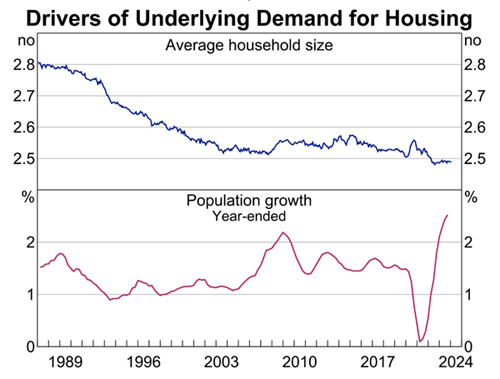
Over the last 40 years, the average number of people in each Australian household has fallen from 2.8 to less than 2.5. This has clearly played a significant role in the demand for dwellings. As Hunter notes, if average household size returned to 2.8, Australia would need 1.2 million fewer dwellings.
Source: RBA
Average household size fell steadily in Australia from the mid-1980s through to the GFC and then plateaued. Since the pandemic it has fallen again and is now below 2.5 for the first time.
Hunter points out that the long-term decline is partly attributable to women having fewer children and to an ageing population (with more households consisting of older couples and singles). But the pandemic has introduced new factors like a post-lockdown desire for more space and the need for home offices in a ‘working from home’ environment.
Australia’s rising population and declining average household size mean rising demand for housing. Basic economics says that, in an efficient market, supply responds to demand. However, in a market as complex as the housing market, the timing of that response is uneven and is affected by a range of factors.
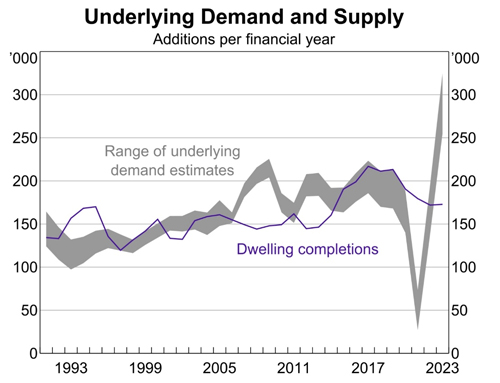
The following graph from the RBA compares underlying demand and supply.
Source: RBA
Sarah Hunter sums up the current imbalance –
Supply, as measured by dwelling completions, has been much less volatile and has trended down in recent years. Overall then, growth in demand is currently running well ahead of supply. Hence the rapid rise in both rents and house prices.
Why hasn’t supply responded more quickly given rising prices?
There are many reasons including pandemic supply chain problems, labour shortages, and a rapid rise in the cost of building materials. And of course, the RBA’s own input – a leap in the cash rate from 0.1% to 4.35% in just 18 months which has dramatically increased the cost of doing business.
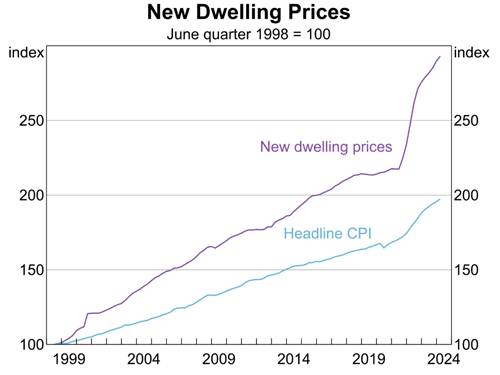
According to the RBA, the cost of building a new home is up nearly 40% since late 2019. The graph below illustrates that this rise is well ahead of general inflation.
Source: RBA
This cost challenge explains why building approvals have slumped in Australia. Fortunately building cost inflation has peaked and is now easing. CoreLogic’s Cordell Construction Cost Index (CCCI) recorded a rise of just 0.8% in the latest quarter to 30 April 2024.
Nevertheless, the RBA expects construction activity ‘to remain relatively subdued’.
What does that mean for the Australian housing market? Sarah Hunter’s conclusion –
Demand pressure, and so upward pressure on rents and prices, will remain until new supply comes online. We expect this response to take some time to materialise, given the current level of new dwelling approvals.
That’s good news for existing homeowners but not for those looking to buy.
Many features identified by the RBA are present in New Zealand. On the supply side, kiwi construction cost inflation leapt during the pandemic, peaking at 10.4% on an annual basis in the final quarter of 2022. The RBNZ’s official cash rate is 5.25% higher than it was in mid-2021. New dwelling consents have fallen sharply in the period since early 2022.
On the demand side, NZ has experienced even higher immigration on a per capita basis than Australia.
These similarities might suggest that NZ has a demand/supply imbalance like Australia that should be pushing up house prices more strongly.
The size of the average kiwi household may partly explain the divergence between the two housing markets. Perhaps the current economic position in NZ is seeing reduced new household formation – more young adults living with their parents, new immigrants living in more crowded accommodation.
According to Statistics NZ, the average NZ household size was 2.7 in 2018 at the time of the last census. In December 2021, Statistics NZ predicted that this number would drop slowly to 2.6 by 2043. More detailed and current data is required to determine the impact of this factor on kiwi house prices.
Finally, it’s worth noting that one small segment of the Australian housing market is immune to factors like household size and immigration levels – the very top end. The strength of this segment is evident from the latest Global Super-Prime Intelligence Report from real estate company Knight Frank.
That report records the number of house sales for more than US$10 million (more than NZ$16 million) in key international markets. In the last quarter of 2023, Sydney had 42 super-prime sales. That’s 42 properties sold for more than US$10 million in just three months. Dubai was first with 108 sales, but Sydney ranked fourth, not far behind New York and London, each with 52 sales.
Demand and supply dynamics operate very differently at that end of the market.
The first story in this series is here.
*Ross Stitt is a freelance writer with a PhD in political science. He is a New Zealander based in Sydney. His articles are part of our 'Understanding Australia' series.
We welcome your comments below. If you are not already registered, please register to comment
Remember we welcome robust, respectful and insightful debate. We don't welcome abusive or defamatory comments and will de-register those repeatedly making such comments. Our current comment policy is here.