
Barfoot & Thompson, Auckland biggest real estate agent, says it sold more properties in January than in any January for six years, and listed the most new properties in a January for five years. However, the average sale price was down 3.7% from December.
Peter Thompson, Barfoot & Thompson's managing director, said the firm listed 1,440 properties in January, the highest number in a January since 1,558 in 2008, and 409, or 39.7%, higher than 1,031 in January last year.
It sold 820 properties in January, down 100 from 920 in December, but the highest level in a January since sales of 1,033 in 2007, and 137, or 20.1%, higher than in January 2012.
January’s NZ$600,754 average price is the first time Barfoot & Thompson has reached an average price above NZ$600,000 in January. Although it's down NZ$23,261, or 3.7%, from December's average price of NZ$624,015, it's up 13.4% on January last year.
The 13.4% rise is the highest year-on-year average price rise since August 2007.
“Normally, January is a quiet month with so many people away from the City enjoying their summer break, but this has not been the case this year,” said Thompson.
“The Auckland housing market is showing all the signs that it has picked up from where it left off in December, and that sales numbers and values will hold up through the remainder of the warm months to come.”
At the end of January Barfoot & Thompson had 3,763 properties on its books, Thompson added, 10.4% higher than December's record low of 3,410, but 21% lower than 4,766 in January last year. Listings represent 18 weeks of sales at the January rate, a relatively low level historically.
"Interest in high end properties remains, and 68 homes sold for NZ$1 million or more in January. Of the total number of properties sold 383, or 47%, were for under NZ$500,000, and of that number 130, or 15.9% of all homes, sold for under NZ$300,000," Thompson said.
Barfoot & Thompson and Real Estate Institute of New Zealand numbers suggest Barfoot & Thompson made 42.5% of Auckland residential property sales in December.
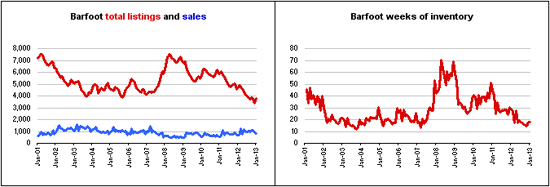
See Barfoot & Thompson's breakdown by areas here.
Barfoot Auckland
Select chart tabs
(Update adds further detail).
We welcome your comments below. If you are not already registered, please register to comment
Remember we welcome robust, respectful and insightful debate. We don't welcome abusive or defamatory comments and will de-register those repeatedly making such comments. Our current comment policy is here.