
Median house prices and sales volumes were sharply down in June, with Auckland leading the decline.
The Real Estate Institute of NZ said the national median selling price was $427,250 in June, down 0.6% on May but still up 8.4% on June last year.
But prices declined more sharply in the Auckland region, where the median declined 4% to $600,000 in June, compared to with $625,000 in May.
The biggest decline was in central Auckland (within the boundaries of the former Auckland City Council) where the median fell 7.5% to $655,750 from $709,000 in May.
Median prices dropped throughout the region and were down by -6.5% in Rodney, -0.3% on the North Shore, -4% in Waitakere, and -3.5% in Manukau.
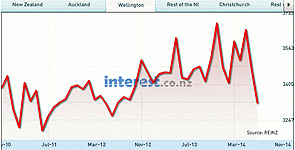
In the Wellington region the median price fell 6.7% to $385,000, with median prices in Northern, Eastern and Southern Wellington and Pukerua Bay/Tawa all posting double digit declines, while prices in Upper Hutt were down 9% and in Lower Hutt they declined by 5.5%.
In Christchurch the median price declined by 1.3% to $430,000 from $435,500 in May but the biggest falls were in provincial Canterbury with the median price in South Canterbury dropping by 21%, Rangiora was down by 15.8% and North Canterbury declined by 13.2% and mid-Canterbury was down 11.1%.
The volume of properties sold was also down on a month by month and annual basis, with 5,763 homes selling in June, down 12.3% compared with May and 6.1% compared with June last year.
REINZ chief executive Helen O'Sullivan said the volume of properties being sold had been declining for several months and in some regions sales had fallen by around 20%.
"At the same time it is now taking five days longer to sell a property than it did 12 months ago," O'Sullivan said.
Around the country - REINZ median selling prices in June
| June 2014 | May 2014 | |
| Northland | $295,000 | $325,000 |
| Rodney | 580,000 | 620,000 |
| North Shore | 747,000 | 749,000 |
| Waitakere | 525,000 | 547,500 |
| Auckland Central | 655,750 | 709,000 |
| Manukau | 560,000 | 580,500 |
| Hamilton | 354,000 | 366,500 |
| Tauranga | 405,000 | 355,000 |
| Mt Maunganui/Papamoa | 420,000 | 461,000 |
| Rotorua | 235,000 | 242,500 |
| Taupo | 332,500 | 364,000 |
| Gisborne | 233,500 | 230,500 |
| Napier | 325,000 | 331,500 |
| Hastings | 269,750 | 273,000 |
| New Plymouth | 346,000 | 310,000 |
| Palmerston North | 270,500 | 299,000 |
| Wanganui | 151,000 | 120,000 |
| Levin | 175,000 | 190,000 |
| Upper Hutt | 305,000 | 335,000 |
| Lower Hutt | 360,000 | 381,000 |
| Northern Wellington | 459,000 | 551,000 |
| Central Wellington | 452,000 | 442,500 |
| Western Wellington | 575,000 | 560,000 |
| Southern Wellington | 464,250 | 540,000 |
| Pukerua Bay/Tawa | 361,000 | 405,000 |
| Nelson City | 375,000 | 358,500 |
| Christchurch | 430,000 | 435,500 |
| Rangiora | 400,000 | 475,000 |
| Timaru | 284,000 | 297,263 |
| West Coast | 180,000 | 220,000 |
| Queenstown | 645,000 | 598,000 |
| Dunedin | 260,000 | 270,000 |
| Invercargill | 171,250 | 176,500 |
We welcome your comments below. If you are not already registered, please register to comment
Remember we welcome robust, respectful and insightful debate. We don't welcome abusive or defamatory comments and will de-register those repeatedly making such comments. Our current comment policy is here.