

Residential real estate asking prices in December 2015 showed continuing signs the market may have peaked. It's been four months since a national record has been set.
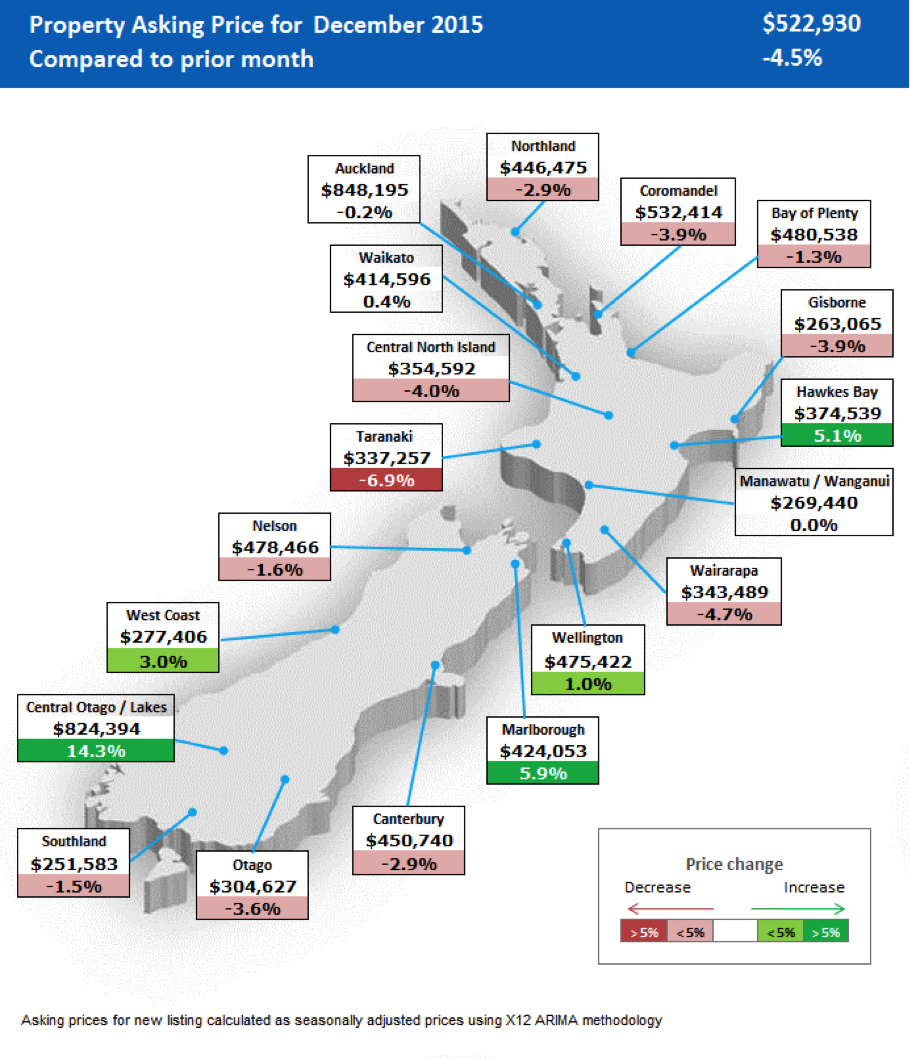
The national average asking price in December was $522,930, continuing a downward trend from the record high set in August of $568,215.
Average asking prices in Auckland and Wellington leveled off, but continued to remain near record-high levels, said Realestate.co.nz in their December Property Report.
Recently, sellers have been coming to the market with higher expectations.
Extensive publicity of 'big numbers in Auckland' have no doubt fueled this trend. Nationally, asking prices have been running about +20% above median selling prices; in Auckland it is more than +10%. But it is not the % that drives these perceptions, it is the $ amount. In Auckland that is difference is about $83,000. Nationally, the difference is $87,000. These variations are not sustainable in the market; either buyers or sellers will need to get more realistic to be able to make a deal. A year ago, the variance was a more reasonable $30,000.
In Auckland, the average asking price was $848,195, marginally below the record set in September of $851,531.
The average asking price in Wellington was $475,422, just below the August 2015 record of $479,399.
Meanwhile in Canterbury, the average asking price in December fell slightly to $450,740, a -5.5% drop on the record of $476,818 set in September 2015.
In Gisborne, the West Coast, Canterbury and Southland, asking prices in December were actually lower than the same month a year ago.
In Canterbury, the decline was marginal, but booming new supply has kept a lid on price rises.
Apart from in Auckland and the Central Otago / Lakes region, average prices are affordable for households on median incomes.
| Average asking prices on | Dec-15 | Nov-15 | Sep-15 | Dec-14 |
| realestate.co.nz | $ | $ | $ | $ |
| Northland | 446,475 | 460,042 | 438,348 | 432,697 |
| Auckland | 848,195 | 849,882 | 851,531 | 731,083 |
| Coromandel | 532,414 | 554,303 | 539,597 | 466,782 |
| Waikato | 414,596 | 413,067 | 391,560 | 381,150 |
| Bay of Plenty | 480,538 | 487,025 | 481,298 | 436,436 |
| Central North Island | 354,592 | 369,556 | 355,103 | 329,058 |
| Gisborne | 263,065 | 273,840 | 254,744 | 331,070 |
| Hawkes Bay | 374,539 | 356,511 | 367,399 | 344,734 |
| Taranaki | 337,257 | 362,389 | 339,961 | 333,846 |
| Manawatu/Whanganui | 269,440 | 268,328 | 268,735 | 260,541 |
| Wairarapa | 343,489 | 360,436 | 377,452 | 327,993 |
| Wellington | 475,422 | 470,596 | 475,392 | 462,511 |
| Nelson | 478,466 | 486,455 | 467,701 | 448,001 |
| Marlborough | 424,053 | 400,344 | 421,001 | 410,213 |
| West Coast | 277,406 | 269,245 | 256,397 | 298,789 |
| Canterbury | 450,740 | 464,006 | 476,818 | 450,919 |
| Central Otago / Lakes | 824,394 | 721,450 | 728,799 | 674,872 |
| Otago | 304,627 | 315,985 | 299,337 | 299,246 |
| Southland | 251,583 | 255,391 | 260,211 | 261,759 |
| National average asking price | $ 552,930 | $ 547,515 | $ 559,775 | $ 480,815 |
| (Median selling price) | tba | $ 459,500 | $ 460,000 | $ 450,000 |
| Asking price premium over selling price | +19.1% | +21.7% | +6.8% |
We welcome your comments below. If you are not already registered, please register to comment
Remember we welcome robust, respectful and insightful debate. We don't welcome abusive or defamatory comments and will de-register those repeatedly making such comments. Our current comment policy is here.