
• Over 40,000 new dwellings were consented.
• But not all the housing has been developed near where people work, meaning longer than desirable commutes in a city working to overcome its congestion challenges.
• The empirical evidence shows that plenty of land has been zoned for housing in work catchments.
• Commercial infeasibility, land fragmentation and access to finance are three inter-related factors that are probably stopping faster redevelopment near where we are adding new jobs.
Boom town
Over the five years to February 2017, approximately 112,000 new employees were added to the Auckland economy, according to Statistics New Zealand. Adding new employers or “bosses”, not included in the employee count, this figure is likely to be over 120,000, or at least an extra 24,000 workers a year on average.
This strong growth in employment is on the back of a burgeoning permanent population, up about 180,000 in five years to June 2017. A surging population has stimulated construction, house prices and retail trade. In addition, strong tourism growth has generated several thousand hospitality jobs.
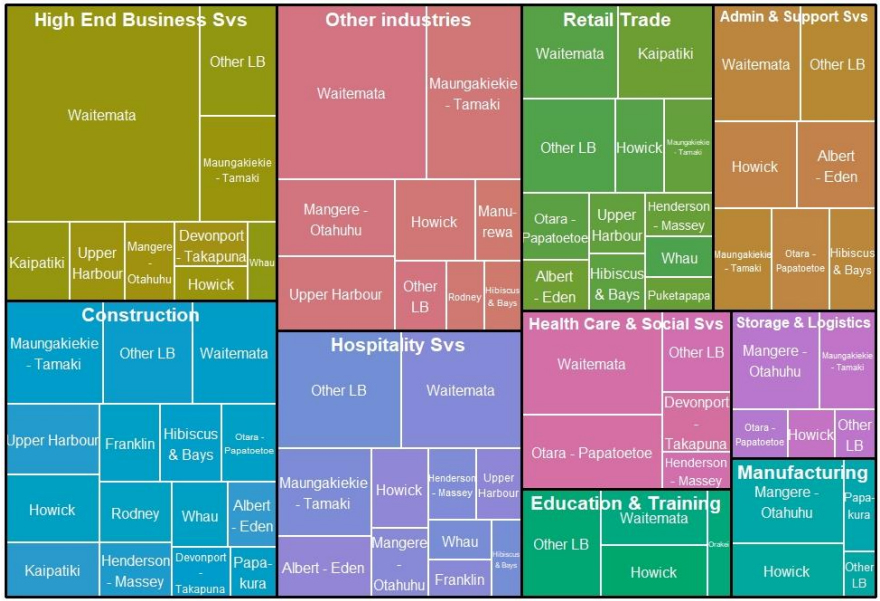
Jobs have been added across the city although it’s worth noting that one in four jobs (28,000) has been added in the Waitemata Local Board area, more than twice as many as in the next largest catchment, MaungakiekieTamaki (12,000, or one in 10 jobs).
The industries that have added the most jobs include high end business services and construction, with each contributing around one in six new employees. Tourismoriented employment is next, with one in eight employees, followed by retail with one in nine.
How are we getting to work?
The results of the 2018 census will provide a far more up-to-date idea of how people are getting to work, and from where. In the meantime, we do have other data we can use. For instance, we know that over the five years to mid-2017, public transport ridership in Auckland, increased 25% even as the population increased 12% implying an increase in average ridership per person of about 11%.
Contribution to Auckland job growth by industry and Local Board, five years from 2011-13 to 2016-18
And as we pointed out in this paper, 10 times more new dwellings are being consented in rapid transit catchments than the physical share of Auckland’s land space occupied by those catchments. People value being close to transport that can get them to jobs and other activities, and the market is responding to deliver housing there.
So public transport is certainly playing a role. But in a city that’s already congested, and where infrastructure has not been able to keep up with the rapid population growth over the last five years, what we want is the shortest possible travel distances and times between where people work and where they live. Is the market delivering this?
A mixed bag of handy housing
We know that Auckland has only recently begun to consent new dwellings at a rate that broadly matches population growth – a remarkable achievement considering that in the year to June 2012, the city consented just one-third of what its consenting today. It also means there is an existing housing shortfall we estimate at around 46,000 dwellings.
But where are dwellings being consented, and how do these locations match up to where the new jobs are?
The maps below show what share of new jobs and share of dwellings consented have been added across Auckland’s statistical areas as defined by Statistics New Zealand. The red circles show a 4km radius around the main centres of job growth. These circles represent a travelling distance of about 5km to jobs, and is where housing would need to be located to maximise the number of people walking, running or cycling to work, or hopping on the bus or train. This would have the benefit of minimising commuting pain for themselves and others on the transport network by decongesting the roads.
The first thing we notice is that the bulk of jobs have been added in just a few statistical areas, while new housing is far more spread out across the city. Just 5% of the city’s statistical areas accounted for 58% of job growth. In contrast, the 5% of statistical areas with the most new dwellings consented accounted for a much lower 36% of new dwellings. There is almost no overlap between statistical areas where lots of jobs have been added, and where lots of housing has been consented.
Second, some areas have seen a similar rate of employment and housing growth, while others are decidedly mismatched. The area around Albany’s centre is an example of a well-matched area – lots of new jobs, and lots of new dwellings being consented.
In many parts of the isthmus, the pattern is more mixed.
Share of new jobs and dwellings added by Auckland statistical area, 2012 to 2017
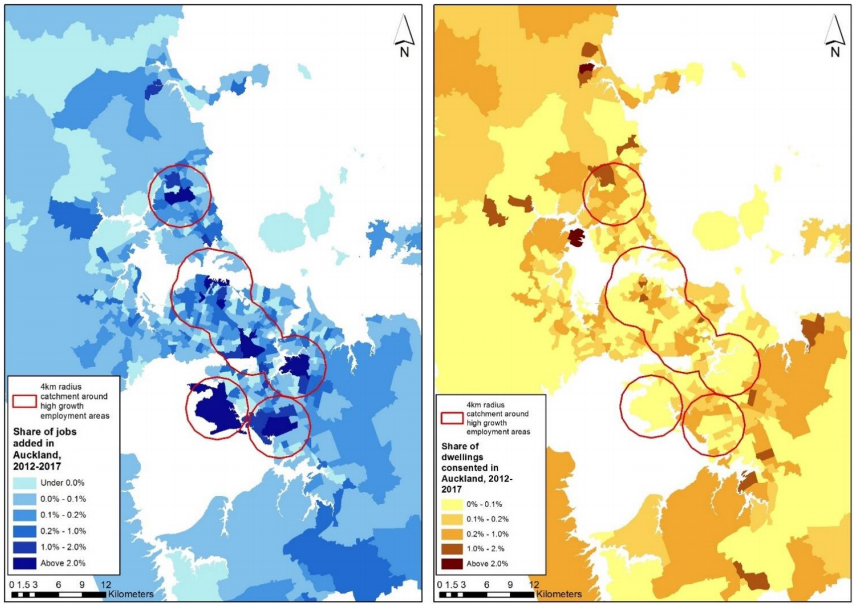
Lots of jobs have been added in the CBD, and areas like Victoria Park, Hobson Street, K-Road and Symonds Street have seen a sizeable number of dwellings consented. But surprisingly little housing has been added near the industrial areas of East Tamaki and even Penrose.
In contrast, areas like Millwater, Hobsonville Point and Beachlands, where huge numbers of dwellings have been consented (nearly 1,700 in Hobsonville alone in five years), few jobs have been added. For Millwater or Hobsonville residents, this likely means a drive to Albany, or possibly a ferry to the CBD for work; alternatively, the bus trip from Hobsonville to Albany will involve a transfer and a 50-minute trip. The growth pattern certainly implies a drive toward the airport or a ferry to the city for Beachlands residents.
While some people will have chosen these locations for lifestyle reasons – proximity to the water, a more rural lifestyle, or bigger sections perhaps – many will have chosen them simply because in a supply-constrained environment, this is where they could afford to buy or rent a house. The longer commute is a by-product of the limited housing options being delivered affordably.
So why isn’t Auckland building more houses closer to jobs, oversupplying some areas far from jobs, and undersupplying some close to jobs?
Is it the fault of zoning restrictions?
No. Auckland has zoned for more than enough housing in all these high-employment growth areas. Even within the red circle covering the airport, where a lot of land is set aside for industrial uses, physical capacity exists to build 22,400 new dwellings over what is already there inside, only including potential in existing residential zones. Those 22,400 dwellings would accommodate seven times as many workers as have been added to the Airport statistical area in the last five years.
And across all the areas covered by the red outline, there is capacity for a further 377,600 dwellings or more than 600,000 workers to be accommodated.1
So what?
Zoning for even more potential dwellings within these areas is not necessarily a bad thing – economics is all about choice, when correctly priced – but the empirical evidence suggests that there are other factors preventing dwellings from being consented closer to jobs.
The usual suspects include commercial feasibility, access to finance, and fragmented land ownership. Most of the land that was upzoned in areas near the airport, for example, is already occupied by lower-density residential uses. This means fragmented ownership in the hands of many owners, a much tougher challenge for delivering larger-scale apartments and townhouses that often require developers to aggregate sections from willing sellers. And even when someone is willing to sell, part of the sale price will be the value of the existing dwelling to the vendor, which is probably a fair bit more than the developer wants to pay for the dwelling on the land, if their intention is to bulldoze it. In other words, commercially feasible opportunities to turn brownfield land into largescale apartment complexes may be quite limited in many brownfield locations.
On the other hand, a preponderance of upzoned properties may be suitable for smaller-scale redevelopment, such as replacing a single dwelling with four to five townhouses, where a willing vendor is a far more likely find. This scale of work would be too small for what a larger housebuilding firm would want to do (which is why they often prefer greenfield development), but could be an opportunity for many of Auckland’s predominantly small to mid-size construction firms. One or two properties like this would keep most of these firms going for the year.
But again there are challenges – primarily in getting funding for the work. This could be a huge opportunity for Kiwibuild to work with smaller builders with a solid track record, to back intensification near jobs. These individual projects wouldn’t have the glamour of a new large-scale Kiwibuild project with hundreds of homes, but would quietly provide housing closer to jobs, perhaps using a handful of multi-proofed designs (i.e. designs that have government approval for rolling out across New Zealand) that could be affordably repeated. The added bonus would be reducing congestion, which would undoubtedly yield investment savings for central and local government.
In summary, Auckland is a fast-growing city working to overcome an infrastructure backlog. This means every extra kilometre someone has to travel on the transport network has a big impact on others. Most days of the week, those kilometres are travelled to get to work. This means the city needs to minimise the distances people cover to get to work by building houses as close as possible to where businesses are locating.
The Unitary Plan has been in place for just over two years now, and there will of course be a lag between the huge change in zoning and the delivery of houses. But Auckland’s mixed success in lining up jobs and housing in the last five years suggests more work is needed to get more houses delivered closer to jobs.
How we did it
Our preference was to use data for the five years to 2018, but the more detailed Statistics New Zealand data on employee counts (Business Demography data) across the 555 Statistics New Zealand Auckland statistical areas is less robust at disaggregated levels. To remove some of the noise in employment changes across statistical areas, we used three-year averages for employee counts, for the periods 2011-13 and 2016-18.
This approach allowed us to estimate the number of employees added (but not employers) in Auckland by statistical area over the five years, and the share of total employee count growth contributed by each statistical area. Business Demography data suggested 112,000 new employees were added between early 2012 and early 2017, compared to 150,000 in the Household Labour Force Survey, but the latter does not provide detailed locational data, and is just a survey.
We used the total number of building consents issued over the five years to June 2017, also recorded by statistical area, and once again calculated the share of total new dwellings consented by statistical area. This data was mapped spatially and a 4km radius drawn around major employment growth centres to represent an approximate 5 km travel distance from jobs. This provided an indication of where we might desire homes to be relative to jobs.
1. There are around 1.6 workers per dwelling in Auckland.
A special thanks to Chad Hu of Auckland Council’s Research and Evaluation Unit (RIMU) for his assistance in mapping the data used in this paper.
*David Norman is chief economist at the Auckland Council. This article was first published here.
We welcome your comments below. If you are not already registered, please register to comment
Remember we welcome robust, respectful and insightful debate. We don't welcome abusive or defamatory comments and will de-register those repeatedly making such comments. Our current comment policy is here.