

By Martien Lubberink*
I still remember the moment it clicked. Sitting in an economics lecture, somewhere in the late 1980s, staring at a blackboard covered in curves: supply, demand, average cost, marginal cost, marginal revenue. There was something elegant about the way it all resolved: set marginal cost equal to marginal revenue, and out pops the optimal decision. No politics, no intuition, no hand-waving. Just logic, drawn on a graph.
It gave economics the aura of a real science.
What I did not fully appreciate at the time was why those curves worked so well. Only later did I discover the Marginal Revolution: the insight, crystallised in the 1870s, that good decisions are made at the margin, not in the aggregate. Forty years on, I still use those graphs. They are, as far as I am concerned, some of the sharpest tools economics has produced.
Economist Deirdre McCloskey makes the point well: “Marginalism is the essence of good economics.” Hard to argue with that. Which is why I find the Reserve Bank's (RBNZ’s) Keeping Cash Local proposal so puzzling: it hardly thinks this way.
I loved studying economics, the first years in particular set me up with the skills that I still find useful today. There were separate compulsory courses on research methods, statistics, matrix algebra, maths, macroeconomics, microeconomics, international economics, finance and investing, organisations, marketing, and accounting.
Against this backdrop, I document three ways in which the proposal lifted my eyebrows, starting with an important research report it rests on, moving to the benefits it claims, and ending with the costs it gets wrong.
The Litmus research: Keys under every lamp post
The RBNZ’s consultation document states, with evident confidence: “Cash matters. It matters now, and it will continue to matter in the future. That’s the strong message we have heard from New Zealand businesses and communities.” To support this claim, the RBNZ commissioned Litmus to conduct qualitative research across 10 rural towns, published in November 2025. Of course, Litmus delivered what it was asked to deliver. The problem lies in how the RBNZ chose to use it.
And there is an uncomfortable asymmetry here. The RBNZ presents the Litmus findings as a strong endorsement of the case for intervention, while the Litmus report itself states, as a plain methodological limitation, that “the survey results are not representative of the population due to the sampling approach used.”
This is an important concern. To understand why, it helps to know how the research was conducted. Litmus visited 10 rural towns across New Zealand, spending two days in each, conducting interviews and surveys with residents, businesses, community groups, and Iwi. In normal research practice, one would expect those 10 towns to be a random or representative selection. They were not. The RBNZ selected them specifically because their communities had already contacted the RBNZ to raise concerns about declining cash access. The Litmus report is explicit on this point: "The towns were selected due to their engagement with the RBNZ about cash services in their communities."
This is actually worse than the proverbial story of the uncle searching for his keys under the lamp post. In that story, the uncle, after indulging in a glass too many, chose a random lamp post. But for the Litmus report, remote communities apparently flagged a problem to the RBNZ: they told there were keys under their local lamp post. The RBNZ commissioned researchers to investigate. The researchers then visited the 10 towns and duly found that, in those towns, keys were indeed under the lamp posts. The RBNZ then reported this back as a “strong message” about the virtues of cash in New Zealand.
The Litmus research is not representative. It was never designed to be. Its findings are consistent across the 10 towns precisely because those 10 towns were selected to surface the problem. The problem in question is real enough: a significant decline in physical banking infrastructure and the resulting barriers to cash access in rural communities.
The selection bias in the Litmus report limits its value as a foundation for a nationwide mandate. And one wonders how much taxpayer money has been spent on commissioning it.
The benefits analysis: Thumbs on scales
To support the consultation, the RBNZ produced three documents alongside the main consultation paper. One of these is the Keeping Cash Local - Technical Paper (Considering the Benefits of Cash). It is, in scope, ambitious. The paper attempts to quantify the full value of cash to New Zealand, working through several distinct channels: government seigniorage revenue, productivity benefits for small businesses, and the broader wellbeing impacts on the roughly 80 percent of New Zealanders who use cash at least occasionally. The conclusion, summarised in Table 5, is that cash generates net benefits to New Zealand of somewhere between $397 million and $2.9 billion per year, depending on which measure you use. Set against the $104 million annual cost of the proposal, the benefit-to-cost ratio looks overwhelmingly favourable.
The problem is that the benefits and the costs are not measuring the same thing.
The relevant cost in the context of this consultation are those of establishing roughly 1,293 multi-bank, full-service cash sites. This is a targeted, incremental intervention. The benefits, however, are calculated against a counterfactual in which New Zealand goes entirely cashless. The RBNZ is comparing the cost of adding a number of multi-bank sites against the total value of cash existing at all. This is a problem of incompatible scales.
The benefit estimates are not directly comparable to the policy’s incremental cost. Seigniorage ($397m), according to the documents, is an accounting measure of government revenue from printing money. The small business productivity benefit ($600m) is extrapolated from a mid-point assumption that businesses lose 0.5% of output in a cashless economy. The willingness-to-pay figure ($437m) was derived from a workshop of 60 people that the RBNZ itself acknowledges was “not a formal willingness to pay study.” The wellbeing estimate ($2.9bn) assumes that a cashless New Zealand would knock 0.1 points off an 11-point happiness scale for four million people.
These figures are not measuring the same thing, and cannot be meaningfully compared.
The deeper problem is not the arithmetic but the counterfactual: the benefits are evaluated against a fully cashless economy, while the costs are only the incremental cost of the proposed standard. The RBNZ downplays costs by expressing them as fractions of sector profit (”1 percent of banks’ combined annual pre-tax profit” which, by the way, is still significant) or basis points (”1.8 basis points”), while simultaneously inflating benefits by using the total loss-of-cash scenario, the most extreme possible counterfactual, as the benefit yardstick. You cannot credibly do both.
Beware of average costs
This is the most fundamental problem, and it goes to the heart of McCloskey’s point about what economics is actually for.
The RBNZ’s costing in its Additional Background Material document relies on what it openly describes as “rule-of-thumb” estimates: $100,000 per annum to convert or relocate existing cash service sites to multi-bank, full-service standard; $100,000 per annum in savings for each surplus ATM retired. Applying these uniformly to 1,293 required sites, minus 250 retired sites, yields the headline figure of $104 million per year.
This is an average cost estimate. The RBNZ uses a network-wide rule-of-thumb figure that is not designed to capture the marginal cost of the least viable sites.
The point of the proposal, however, is that it aims to extend services to areas currently without adequate access. Rural, remote, low-transaction-volume locations that do not currently have full-service cash sites do not have them because they are expensive to serve. That is the very problem the standard is trying to fix.
The two graphs below illustrate the issue. The first shows the total cost curve for a network of cash service points (CSPs), with lines drawn from the origin to points along that curve. The slope of each line is the average cost at that quantity: as the number of sites increases, the line rotates downward, reflecting falling average cost, until … well … until they start rising again. The second graph makes this explicit, plotting average cost and marginal cost directly against the number of sites calibrated to the RBNZ's own network figures: 2,159 current cash service sites, with a conversion cost of $100,000 per site.
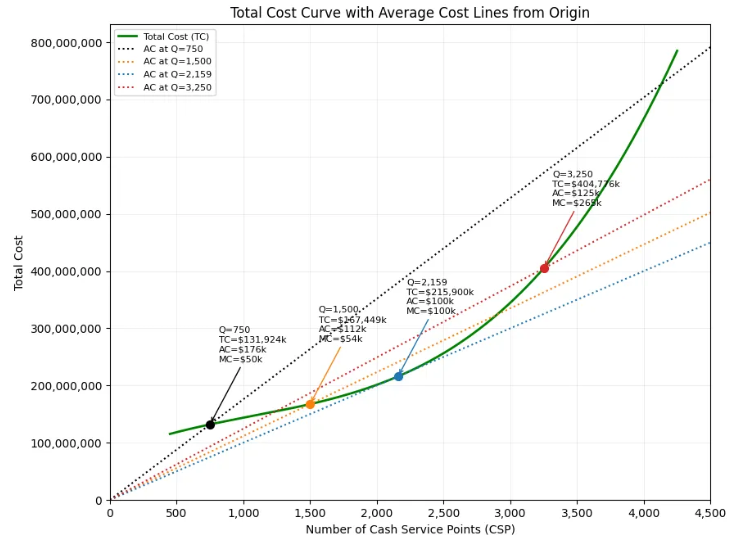
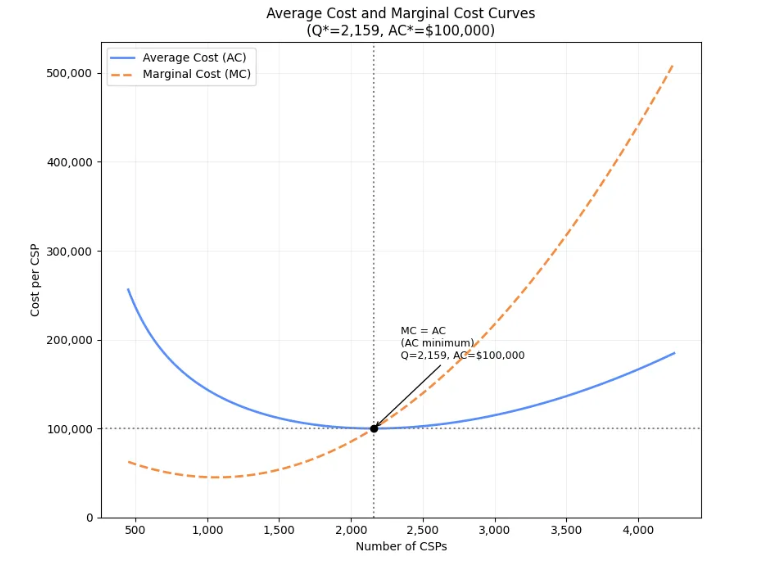
The key insight from the second graph is that the marginal cost curve (what each additional full-service CSP costs) lies above the average cost once you move past the point of minimum average cost. By the time you reach the last tranche of sites required to meet the standard, in remote towns with difficult logistics and security concerns, the marginal cost of each additional CSP is likely well above $100,000. The rule-of-thumb estimate tells us very little about the cost of sites that do not exist precisely because they are too expensive. These are, in a sense, Schrödinger’s cash service points: required by the standard, yet commercially non-viable under current market conditions, and therefore without any reliable cost history to anchor the rule-of-thumb.
The graphs make the point starkly: except at one point, the average cost and the marginal cost never agree. Remember: the marginal revolution tells us to trust the marginal cost.
The RBNZ acknowledges its rule-of-thumb is likely “on the high side.” That is fine as a gesture toward conservatism. But conservatism about the average is an entirely different matter from understanding the marginal cost of the last, least commercially viable cash service point. Understating the marginal cost of the rural tail does not make the overall cost estimate conservative. It renders it systematically flawed in the direction that matters most for the decision at hand.
This distinction is not exotic economics. It is the discovery of the 1870s that McCloskey writes about. The correct question is not “what does a cash service point cost on average?” but “what does this specific service point, in Te Araroa or Rakaia or Methven, cost, and what does this community gain from it?” Applying a uniform average cost to every site, while measuring benefits against the total elimination of cash, is precisely the backward thinking that marginalism was intended to correct.
Embrace opportunity costs
There is a deeper problem with the $100,000 figure beyond its averaging. It is an accounting estimate, not an economic one. It apparently counts the bills: machine servicing, cash replenishment, transport, insurance, site lease. But it does not ask what those resources could otherwise do. A proper economic cost estimate would include the opportunity cost of a rural cash service point: the forgone returns on capital tied up in low-yield infrastructure, the alternative technology investments that $100,000 per year per site could fund, the management attention diverted from higher-value activity.
None of this appears in the RBNZ’s analysis. To its credit, the RBNZ does apply some cost discipline to itself: it deducts $70 million per annum from its benefit estimates to strip out value attributable to its own cash operations and regulatory administration, avoiding the temptation to take credit for work it is already doing. But this discipline does not extend to the costs it imposes on others. The opportunity cost of capital that banks would be required to deploy into low-yield rural cash service points receives no equivalent treatment, it simply does not appear.
Then there is the question of asset life. The $100,000 is an annualised figure, which implicitly assumes the investment is indefinitely renewable: that each year is like the last. But ATM technology is not a stable infrastructure class. Cash use in New Zealand has been declining for some years now, digital payment infrastructure is advancing rapidly, and it is genuinely unclear whether a physical network of this scale will still be the right solution in 10 or 15 years. An honest cost estimate would account for the stranded asset risk: the possibility that banks mandated to invest in multi-bank rural cash service points today will be left holding expensive, underutilised infrastructure within a decade or so. The annualised framing obscures this. A regulator asking banks to commit to a long-term capital programme should reckon with the terminal value of that investment.
There is a further potential inconsistency worth noting. The RBNZ excludes one category of bank costs from its analysis: the loss of cash-related fee income that banks currently charge customers. The rationale is that this is a transfer. What banks lose, customers gain, so the net economic effect is zero. That is an acceptable argument in, if my mind serves me, welfare economics. But it looks like the RBNZ does not apply it consistently. By the same logic, the $104 million compliance cost, once passed through to customers via higher interest rates or fees, is also a transfer within the New Zealand economy. Yet the RBNZ counts it in full as a cost, without applying the same netting logic. I found it confusing: excluding fee income losses on the one hand but counting compliance costs in full looks like another thumb on the scale.
What this means
I am not arguing that cash access in rural New Zealand is unimportant. It clearly matters to people, and there is a legitimate policy question about whether a market equilibrium in which banks exit rural communities is socially optimal.
But the RBNZ has employed a lot of economists, spent a lot of time on this proposal, and produced documents that do not apply basic tools of economic analysis. One research foundation is not representative. The benefit measurement is not comparable to the measurement of cost. And the cost estimate uses the wrong metrics.
In this context of flawed research, the RBNZ should perhaps pause before proceeding with the standard. Taxpayers, and ultimately bank customers, will pay for whatever the RBNZ decides. They deserve analysis that looks forward, at the margin, rather than backwards at the total.
But there is a larger concern here. The RBNZ’s core mandate is financial stability. When a crisis hits, the institution will be asked to make consequential decisions quickly, under pressure, with incomplete information. That demands exactly the kind of rigorous, marginal thinking that this consultation conspicuously lacks.
If the analytical standards on display here are representative of how the RBNZ approaches complex economic questions more broadly, that is a worry that goes well beyond the price of a rural cash point. The 1870s called. One hopes someone at the Reserve Bank picks up.
*Martien Lubberink is an Associate Professor in the School of Accounting and Commercial Law at Victoria University. He has worked the the central bank of the Netherlands where he contributed to the development of new regulatory capital standards and regulatory capital disclosure standards for banks worldwide and for banks in Europe (Basel III and CRD IV respectively).
This article first ran here and is used with permission.
4 Comments
Why would you not ask communities with absent cash services to describe what problems are caused.
In cities, where such services exist, folk would have no experience of the challenges. Nothing to describe.
The message is take from this is that the qualitative survey had inherent bias and that the author infers that the research capacity of RBNZ is called into question.
What he has given lip service to is that rural communities possibly should have reasonably convenient access to banking facilities.
All Kiwis should have reasonably convenient access to banking facilities. When I lived in Karori, Kiwibank closed its branch. The nearest branch at the time was either Johnsonville or Lambton Quay. This was still in the era of cheques. I didn't think I had reasonably convenient access to banking facilities. Now where I live, my nearest Kiwibank branch is 100km away.
The RBNZ did not come to my community but I am very confident it would have got results pretty much identical to the communities they did canvass
I hope the author never experiences the devastating, isolating impacts of the likes of Cyclone Gabrielle on the east coast, or Christchurch and Kaikoura quakes in the south. But if he did, I think he would change his tune about the appropriateness of the RBNZ survey methodology. It is entirely appropriate to limit the survey panel to those communities that experience the greatest impacts of the banks closing branches wholesale in small communities. Availability of cash is vital to those communities.
Cash is King.
All Communities need local banking facilities.
Stop this march to Centralising everything on Wellingtom
Vox Populi, Vox Dei; no matter the expert misgivings and selectivity.
See the first excellent comment.
We welcome your comments below. If you are not already registered, please register to comment
Remember we welcome robust, respectful and insightful debate. We don't welcome abusive or defamatory comments and will de-register those repeatedly making such comments. Our current comment policy is here.