

Long end bond and wholesale rates are falling fast. The pace of the drop picked up today as markets absorbed what the tamer US inflation data will mean.
In the US, their ten year benchmark bond rate (UST 10yr) has now fallen to 3.45% and its lowest since September 2022. The UST 2yr equivalent is now at 4.14%. That is a negative rate curve larger than anything we have seen in more than 40 years, since 1981.
Persistent negative rate curves are often precursors to recessions. Most analysts, even central banks, do see recession conditions ahead as the battle for control over resurgent inflation goes on.
Locally, we have reached an historic point with our rate curves. Our NZGB 10 year rate fell sharply today, now down to 4.07%. That is a -51 bps retreat just since the start of 2023. Recall it rose very quickly in December, from a low on December 5 of just 4.00%. It has been yawing up and down in that range since September 2022.
But its variation from our two year rate has been growing and is now negative by almost -50 bps.
However, in wholesale swap markets, the inversion is now well above that, and very likely to exceed -75 bps today. Since we have been monitoring the 2-10 swap curve starting in 2007, it has never before blown out to more than a negative -100 bps before, but it did reach more than -90 bps in the middle of December 2022.
Wholesale interest rates are influential for mortgage pricing. Obviously we don't have 10 year mortgage rate offers in New Zealand, but we do have five year offers.
The 1-5 year inversion is now at its record low of -100 bps, and very likely to push through to new territory later today. Update: it ended today at -104 bps, a new all-time record low.
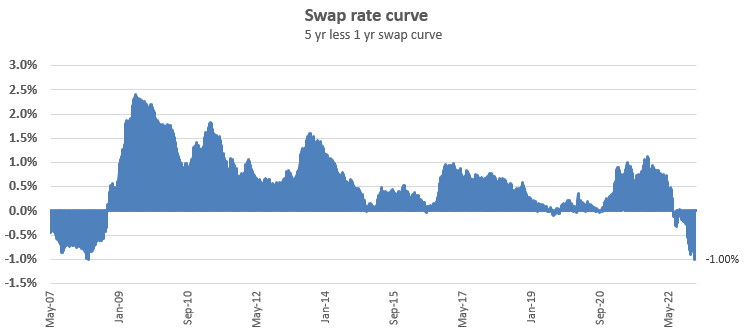
The last time we were in this position was in February 2008.
And the last time the RBNZ OCR was at about the current level was in January 2009.
This is how mortgage interest rates compared then.
| Bank averages | Floating | 1 yr | 2yr | 3yr | 4yr | 5yr |
| % | % | % | % | % | % | |
| February 2008 | 10.36 | 9.76 | 9.47 | 9.24 | 9.10 | 8.92 |
| January 2009 | 7.42 | 6.68 | 6.83 | 7.02 | 7.08 | 7.07 |
| January 2023 | 7.64 | 6.36 | 6.58 | 6.64 | 6.91 | 6.96 |
Current average bank mortgage rate levels are not too dissimilar to the 2009 levels when the OCR was at a similar level.
But the rate curve history suggests that there could be a shift down in fixed five year mortgage rates on the way if history is any guide. In 2008 when we had a similar inverted rate curve, five year rates were -50 bps lower than two year rates. Currently ours are +40 bps higher. That suggests there may be as much as 90 bps that could shift lower over the next few months if the inversion stays as it has suddenly become. That is a big 'if'. Clearly banks will wait for two things to play out - that the inversion stays, and that competitive pressures compel them to move.
Wholesale rates are not the only factor in where retail mortgage rates are pitched and wholesale rates are only influential for the main banks who source wholesale funds. Most of our smaller banks rely on retail funds for mortgage lending. If long term rates do move down (and it is no certainty), it will almost certainly drag longer term deposit rate offers lower with them.
The idea than this rate inversion will linger doesn't have a strong historical track record to back it up however. When we last hit the -100 bps inversion, it was unwound rather quickly. In that case, regulatory action kicked in to weigh against the 2008-2012 recession. The situation turned sharply the other way, as you can see from the chart above.
We welcome your comments below. If you are not already registered, please register to comment
Remember we welcome robust, respectful and insightful debate. We don't welcome abusive or defamatory comments and will de-register those repeatedly making such comments. Our current comment policy is here.