

The third week in September 2017 turned out to be of enduring importance.
All our local attention was on the General Election, one that produced an outcome only possible under MMP. It signaled a change of direction in how public policy was to be articulated in New Zealand. But because New Zealand political contests are for the centre ground, in fact money markets didn't expect anything material to really change in our economy.
And, in fact, not much has. General prosperity has continued with little threat to financial stability or fiscal discipline.
But another event happened that week that has turned the money markets upside down with a slow but relentless change. This event could in fact have substantial impact on the New Zealand economy.
That event involved just 25 words:
In October, the Committee will initiate the balance sheet normalization program described in the June 2017 Addendum to the Committee's Policy Normalization Principles and Plans.
Those words are contained in the press statement of the US Federal Reserve's Federal Open Market Committee's meeting of September 20, 2017 (September 21 NZT), and almost as an afterthought.
The impact over the past eight months has been substantial, and it will grow further over time.
Previously, the sovereign rate risk hierarchy was well understood. UST yields were 'risk free' and set the benchmark. Sure German Bunds may have already yielded less, and in some cases even negative interest rates were imposed by policy makers. But that was "Europe" which had special, endemic growth issues to contend with. The UST interest rates still set the benchmark. Other non-recession-bound economies operated at a premium the USTs, and Australia and New Zealand were counted among them. And China, being the dominant emerging market operated at a substantial premium over that (principally because of governance risk).
Since 2008 when the US central bank turned on the monetary tap, the money supply reservoir has filled to a stupendous US$4.3 tln - US$2.5 tln in treasuries and US$1.8 tln in mortgage-backed securities. The September 20, 2017 signal was that they shifted to a program to drain the reservoir in an attempt to get it back to normal levels.
All this affects supply & demand pressures. The Fed is now selling - each sale removes cash from the financial system. There was supposed to be more UST available for trading.
About the same time, bond markets started to understand that the US Federal fiscal situation was going to deteriorate rather quicker than expected. The claims of growth from corporate tax cuts were just not going to materialise, and the US Federal budget deficit would swell fast requiring it to be paid for by issuing vast new amounts of USTs.
But demand for all this extra debt is not expected to grow as fast as the supply. So investors expect higher yields.
What wasn't expected was that much of those higher yield expectation was for political risk, a premium that had been low in the past. A Trump-risk premium.
The change has been sharpest at the short end. The blue line in this next chart is the USA 2yr UST bond yield. Its rise since September 20, 2017 has been steady and consistent. The Aussie equivalent has risen marginally while the New Zealand equivalent has fallen marginally.
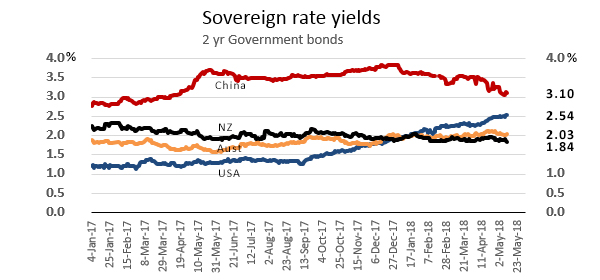
These moves have upended long relationships of premiums to the UST benchmarks.
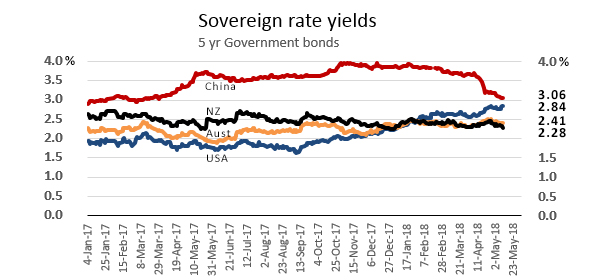
Similar shifts are apparent for the 5 year government paper ...
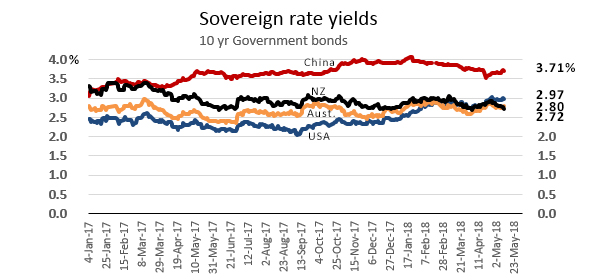
... and also the ten year bonds, although they are more muted at this longer duration.
One way to look at these changes is to work out the rate curves. The principal one is the 2-10 curve, the simple difference between the bond yields of these two durations.
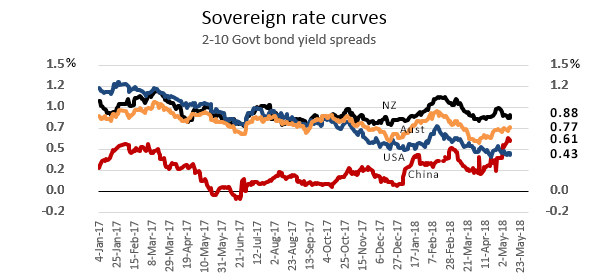
And here we can clearly see the American narrowing of the difference. In fact, that difference is its smallest since 2007. When longer-term interest rates fall below short-term rates, investors may be signaling a lack of confidence in future growth. The phenomenon often precedes a recession. We are not there yet, but in less than eighteen months the 2-10 difference has gone from about 120 bps to just over 40 bps; that is not only a big move, it has been a steady and relentless one. It is the bond market sending a powerful, consistent signal.
Another way to look at this data from a New Zealand perspective is to watch the US : NZ premium for each major duration. And the shift is quite striking, pivoting around the September 20, 2017 date.
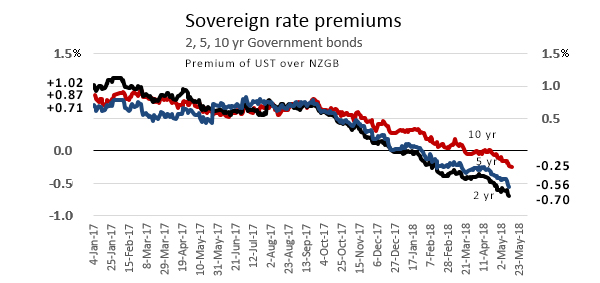
Two years ago it would have been hard to imagine a bond world where New Zealand Government Bond yields would go from +60 to +100 bps premiums, to -25 to -70 bps discounts to the American equivalents. Not only has it happened, the discount seems to be picking up pace. Of course, not everyone thinks it will continue, or can even be sustained. But it has happened and is the present situation.
The local factors
We have talked about the US drivers, but there are also local drivers, two principal ones.
Firstly, the New Zealand government remains committed to running surpluses in their fiscal affairs. This is now bipartisan. These surpluses, which evaporated in the GFC, returned in 2015. They were consistent but small until early 2017, but since have swelled as rising prosperity has increased not only company tax collections, but more impressively personal taxes and GST as well. The track is for substantial surpluses. In 2018 they are running at the rate of +$6 bln/yr for the core OBEGAL definition and have been at a whopping +$10 bln/yr pace on a full Operating Balance basis.
Given the gross Government debt is 'only' just over $80 bln (and much less on a net debt basis), surpluses at this level are impressive. It allows a bipartisan commitment of keeping this debt at no more than 20% of GDP. Nominal GDP is growing quickly, up +6.5% in 2017, allowing plenty of room for nominal public debt growth and still meet the targets.
But surpluses don't require more borrowing. They work to depress debt levels. That in turn means that demand for risk-free NZGBs is likely to out-pace supply, keeping yields low. It is hard to see that dynamic changing anytime soon.
And it is not as though NZGB debt is popular for foreigners. It might be, but it is also irrelevant in the grand scheme of things. In a world bond market that now well exceeds US$100 tln, our NZGB $80 bln or so is just a rounding error and is treated as such by international bond investors.
In fact, the holdings of New Zealand government debt by foreigners is now down to just 54% and its lowest since 2012. Other Government agencies (like the NZ Super Fund, ACC, the RBNZ, etc) hold just under 20%. And the "financial sector" holds just over a quarter of this debt, and that is rising. This is where the additional demand will come from, due in large part to investment mandates that have a growing appetite as the economy grows.
And that is the second principal driver. At its heart is KiwiSaver. A fat 42% of all KiwiSaver investment is in Conservative, Default or Moderate funds. All these have high allocations for fixed income securities. While the world is open to them for these allocations, an important proportion will go into NZGBs. Some investment funds (usually not KiwiSaver) are required to hold only NZGBs. So if the inventory of them falls, yields are clearly going to be bid down as excess demand bids up the price.
It is important that Treasury keep a New Zealand debt market supplied with enough capacity to meet investors needs. Even now, there is a shortage of NZD debt traded, as anyone who wants to buy retail can tell you. These markets are captured by the big advisory distribution channels, often at the cost of very low yields for investors. As we have noted on this service before, its is usually better to get yield from bank term deposits, although they don't have the liquidity a bond market offers.
KiwiSaver is now a sector about to grow past $50 bln, $20+ bln or more in the conservative end. This sector is rising at about $10 bln per year and the pace will pick up. (The NZ Debt Market has proven to be of little help, stuck at about only $24 bln capitalisation.) This is a a good reason for the NZ Government to be adding to capacity; Another $4-5 bln per year will be needed just to ensure our bond markets function properly and don't get distorted in the way they did in the Clark/Cullen years when debt was paid down to very low levels. Memories are short.
So what does this all mean?
We are facing a long period of low NZGB yields, and that has little to do with international benchmark pricing:
- international bond traders ignore our markets because they are so small, with tiny capacity,
- the NZ Government is likely to be running large surpluses, require little extra debt funding,
- KiwiSaver demand for fixed income securities is rising and the pace is picking up.
In the long run, lower-than-international benchmark yields should get equalised in the currency markets, driving down the value of the Kiwi dollar. The main driver of the NZD are trade flows. That can easily be interrupted by major capital demands (like the insurance flows following the Christchurch earthquake), or heightened loan demand arising from property speculation. But those two examples are behind us now. Over the longer run however, the interest rate differentials will influence the currency.
We are in a period where interest rates will stay low, and our currency will slowly slip. Just a guess, however.
We welcome your comments below. If you are not already registered, please register to comment
Remember we welcome robust, respectful and insightful debate. We don't welcome abusive or defamatory comments and will de-register those repeatedly making such comments. Our current comment policy is here.