

Worldwide, benchmark bond yields are falling. Benchmark yields (for government bonds) are lower by the day.
On Friday, the NZ Government 10 year bond yield fell to 2% for the first time ever. This is some milestone. (But it ended just a part of a basis point higher.)
Overnight, there have been big moves lower for benchmark bond yields.
How investors price bonds is an important signal for investor sentiment. It is a wisdom-of-the-crowd thing; they don't always get the signal right, but history clearly shows it often does, especially for medium term trends, and almost certainly for longer term trends.
Part of that may be self-fulfilling. But in any case, investor sentiment is important to watch. Surveys capture what respondents tell surveyors; but pricing is where investors act with their own money.
Here is how Government bond 10yr yields have moved over the past two years or so.
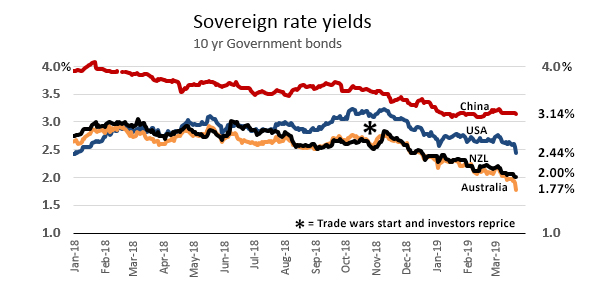
In the past five months - since November 2018 - the track of these yields has been clearly down. The first US tariffs in their trade war with friends and rivals alike came into effect then. Investors sensed this would undermine future prosperity and have ajusted their pricing since. Subsequent data has reinforced the view. Equities took a thrashing in the October to December period, but have recovered in 2019.
But bond investors have a history of pricing their risks more in line with much longer term economic trends. The US Fed and other major central bank signals play a larger role. The US Administration's behind-the-scene's attempts to twist the Fed for short-term gains won't have gone unnoticed by bond investors who will have concluded that such messing about won't have positive longer term outcomes.
And the sudden ballooning of the US federal fiscal deficit - as a percentage of GDP - pushed on to a track that many may think is unsustainable - is another factor.
All this gave bond investors a risk-off mind-set. And in those circumstances, money piles into government guaranteed instruments. And when that happens, yields fall.
QE also swells the volume of money chasing investment opportunities, an effect that will depress rates too.
And demographics will play a part - an increasing part - as the baby boomer generation move to convert their equity holdings to more conservative settings (remembering that at some point they will consume these investments, through decumulation).
October 2018 stands clearly marked as the start of the fixed income investor crowd taking collective fright at these trends.
For them, the return of capital become a rising priority, more important than the return on that capital.
In a low inflation world, the risks of capital being eaten away by price rises diminishes at the same time, giving these investors space to worry less about short-term returns.
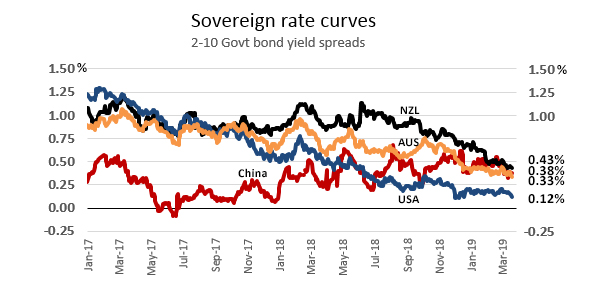
Two-ten yield curves are one thing, one that is easy to follow. But in the US the 1-5 curve has become inverted. Today (Friday on Wall Street) that inversion widened to -21 bps and as much as we have seen it.
And the spread between three-month Treasury bills and 10-year note yields inverted today for the first time since 2007.
Inverted yield curves never signal that the future will be positive, even if they don't always signal a coming recession. But in the past half a century they have given a false signal only once.
It doesn't take too much imagination to see the 2-10 curves graphed above becoming inverted relatively soon as well. As the sage once said, "If you do not change direction, you may end up where you are heading".
We welcome your comments below. If you are not already registered, please register to comment
Remember we welcome robust, respectful and insightful debate. We don't welcome abusive or defamatory comments and will de-register those repeatedly making such comments. Our current comment policy is here.