

Auckland's nominal Gross Domestic Product (GDP) has topped $100 billion for the first time and is bigger than the combined GDP of New Zealand's second, third and fourth largest regional economies.
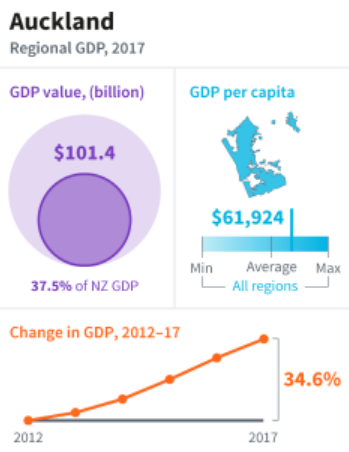
Statistics New Zealand says the Auckland region's GDP hit $101.4 billion last year, equivalent to 37.5% of NZ's total GDP. Statistics NZ's provisional figures show Auckland’s regional economy increased in value by $6.1 billion, or 6.4%, between March 2016 and March 2017.
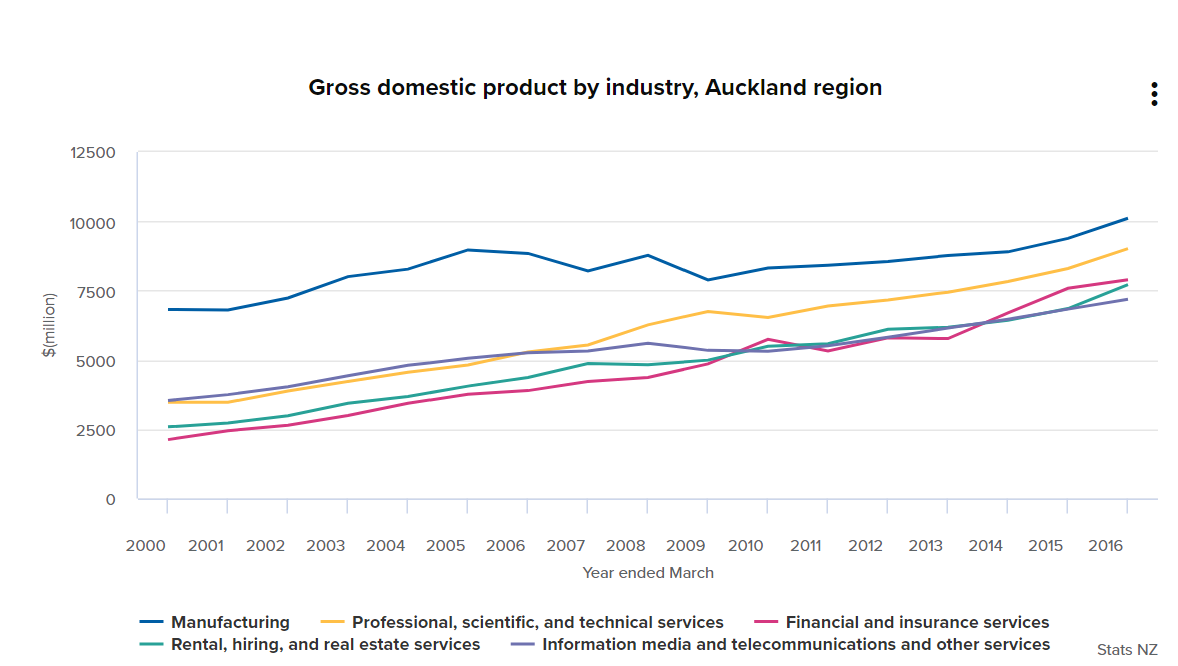
"The increase was driven by strong rises in the rental, hiring, and real estate services, construction, and finance and insurance services industries. However, the 2017 increase is smaller than last year’s increase, when Auckland’s regional economy rose 7.8%," Statistics NZ says.
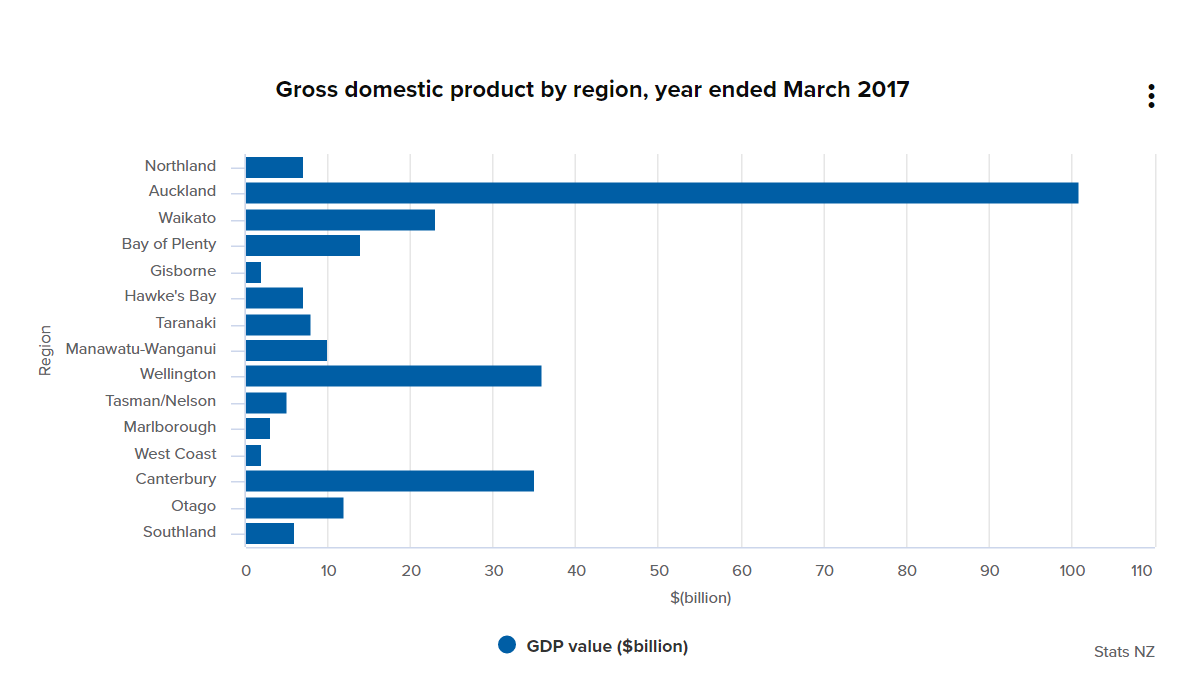
"Auckland’s top 18 industries are each valued at more than $1 billion. It is by far the largest regional economy in New Zealand – the next-largest is Wellington, which is valued at $35.6 billion. Auckland’s share of the national economy is 37.5%."
In fact adding the next three biggest regional economies together - Wellington, Canterbury and Waikato - gives combined annual GDP of $93.3 billion, still $8.1 billion, or 8%, smaller than Auckland's GDP.
According to Statistics NZ, between 2012 and 2017, Auckland’s economy grew by 34.6% versus the national increase of 26.9%. Auckland’s share of national GDP rose 2.2 percentage points, to 37.5%.
Meanwhile, Taranaki remains the region with the highest GDP per capita at $70,863, followed by Wellington at $69,851, and Auckland at $61,924. The national average was $57,002.
Other March year provisional annual estimates from Statistics NZ show:
- The GDP of all 15 regions increased, with the national GDP growing 6.2%, or $15.9 billion.
- New Zealand’s total nominal GDP was $270.6 billion, with the North Island contributing 77.3% to the South Island's 22.7%.
- At 9%, the Bay of Plenty region had the largest percentage increase, followed by Northland and Waikato with both at 8.2%, and Southland at 7.9%. The Wellington region had the smallest increase at 4.6%.
- Taranaki and the West Coast, where GDP declined the previous year, both increased, rising 5% and 7.1% respectively.
- The West Coast region made the smallest contribution to national GDP, at 0.6%, slightly below Gisborne’s 0.7%.
Statistics NZ's full regional breakdowns are here. The charts below come from Statistics NZ.
17 Comments
AKL (working) population > Wgnt + Cant + Waikato (working) population
Yes - Auckland has come of age and is now one of the most desirable cities in the world to live in.
TTP
Is that why everyone I grew up with in Auckland left?
Aren't you the common factor there? I knew lots of people born and raised in Auckland, Just saying.
With the majority of our national income being derived from agriculture, Auckland's contribution to our national export income is pretty minor, especially when related to their population. This huge amount of money being spent in Auckland is a drain on the rest of the countries export producers, so the high figure is more of a worry than anything. A hole bunch of folk building each other houses making coffee and the myriad of other relatively trivial other activities that go on there may add hugely to the GDP, but do little for the real well being of the country. GDP is not a very god measure of our economic health. We could seat half the population in a big circle, scratching each others backs for $200,000 per year (the money just going round in a big, silly circle) . It would do wonders for the GDP but place a large burden on the other half of the population who at some point have to fund them
You might be interested in Jenee's article here Chris - https://www.interest.co.nz/news/92728/how-future-governments-policies-and-spending-priorities-will-be-shaped-both-wellbeing-and
The best way to set up any measurement for a system that you are trying to improve, control or maintain stable, is to to measure the variable that most directly relates to the outcome that you are trying to achieve and is most directly effected by the variables that you are altering to effect control. I.e you want a tight control loop where the thing measured is directly affected by the variable(s) that you are altering to effect control. E.g. changing the position of the steering wheel according to your displacement from the desired position on the road.
If we focus on measuring GDP, then our natural tendency is to alter the variables that maximise GDP. Clearly this is the way our economy is measured and it appears that it is managed to maximise this. As I illustrated above and Jenee's article points out, this can lead to some silly situations that superficially indicate success, lead to outcomes that are not in our best interests, and suggest that the highest GDP is not really what we are after. I would have more faith in paying more attention to our balance of payments, productivity, average wages, cost of living and equality of wealth distribution. These are the engines of wealth that will provide the money that will ensure the well being of every one. These are pretty concrete variables and easy to measure. They are also targets that can be more readily related to the variables that we can alter to effect change. Get these right and a lot of other stuff will be improved also.
With reference to the more general and all encompassing measurement of well being in Jenee's article; well it may be useful for giving you a very general picture of how people are getting on, but it is not much use at giving any direct help in how to steers the "ship" Too general, too diffuse and will lead to rather poor and floppy control. In terms of my car steering analogy, it is a bit like trying to steer a car by measuring how comfortable the passengers are. If social outcomes are what you are trying to measure then the it would be more useful to measure the individual components that go into the more general index of well being, e.g. infant poverty homelessness, lower quartile income, ...... etc. They will give a better indication of where and how to direct our attention. More direct leading to tighter and more effective control.
Well-being is vague. But there is a simple accurate way of measuring it: look at kiwis leaving NZ. If they think their well-being is better elsewhere the question is why. Maybe it is to get married for for work experience but a simple survey would identify if they thought their well-being in NZ was getting better or worse and had influenced their decision.
Remember though that when people sing the praises of the globalisation the reality is that migrantis are heading to "a shrinking pool of prime destination countries", so there won't always be better to go to except for the best qualified.
Now we just need a small public administration that lives within its means ..... not this wasteful and useless expenditure we are seeing currently
Witness to the brilliant economic managers that were in power
They were not brilliant economic managers, if they were our health system, education and more would not be in such a dreadful state. Any fool can underfund something and just wait until it reaches the point of collapse, then bail out and let someone else try to sort it out.
IDENTITY 10 Oct 2017
The changing face of New Zealand
From Nine To Noon, 11:28 am on 10 October 2017
The year they are predicting Asians will supercede Moari is 2023. So the recent population growth (immigration) is bringing those tipping points forward.
Ryan: Weve had four years of record high. And that was not anticipated.
Are we pretty much now just about the most diverse country on earth?
Spoonley: Absolutely we are. One of the key elements of those projections is the growth of the Asian populations (and I want to pluralise that). And when you look at the country or a city like Auckland it is much higher than any comparative city. Not Vancouver, Vancouver is higher. But in terms of a city like Sydeny then the proportion of Aucklands population that is predicted to be Asian is quite a bit higher than those type of cities. And by the way, we track across to London and we think, gosh, we are in quite a multicultural place here, but when you look at the total Asian population, the proportion relative to the local population we still beat them.
Ryan
Let's look at the overall makeupof the population. Pakeha New Zealanders will grow but decline as a proportion of the population. In fact probably not far off being less than 50% of Aucklands population?Spoonley
No, I think that's quite sad actually, that's one of those tipping points. They'll become what they call a majority minority. So they are still the largest group but they will be less than 50% of the population.Ryan [jokes] do they have a mandate... no sorry.
Spoonley
Hey it's an interesting discussion. It is dawning on us how diverse we are, and what do we need to do?
Ryan
So that's whats happening in Auckland. Nationwide is it on a similar track?
Spoonley
Yes
http://www.radionz.co.nz/national/programmes/ninetonoon/audio/201861730…
Ryan
Any other standout or surprises to the numbersSpoonley
and the context is that we are growing at 2.1% which is high. If you nlook at the numbers of Asians they are growing at 3.5% , So tha's why the're contributing.Pakeha are growing at less than .5%
So that's why we are seeing this diversification.Ryan
and it's also in some ways the argument for immigration isn't it
Spoonley
Hmm
Ryan
because in some ways your gonna need taxpayers, especially as that baby boomer demographic retires. We know there are some big issues coming up there.
Ryan poses the question to "immigration expert" ; "Distinguished Professor"; "demographer Paul Spoonley". Spoonley says Hmm. Yet the BSA don't consider this a statement of fact? Therefore no one is misleading anyone.
3.6 Population ageing
Increases in net migration are sometimes suggested as a solution to the problems created by population ageing. While temporary inward migration may help mitigate the effects of population ageing, those migrants who become permanent residents will also eventually retire and increase the old-age dependency ratio (see Figure 2). Overall, the present pattern of net migration reinforces population ageing, as emigrants tend to be younger than immigrants.In looking at results for countries and regions including Japan, Germany and Europe, the United Nations (2001) concluded that in order to materially mitigate the impacts of population ageing, flows would need to be many, many times existing population inflows from migration. Jackson (2014) is presently estimating the extent of inward migration flows that would be necessary to compensate for population ageing and outward migration in New Zealand. While exact numbers are not yet available, the same pattern holds: inflows will need to be many times existing levels to make a material impact.
http://www.treasury.govt.nz/publications/research-policy/wp/2014/14-10
The only people with the resources to tell us how much we love Auckland are those with a vested interest in the results.
How about grading things like access to internal sunlight.
Access to green space
Number of cars of the street
social cohesion "should auld acquaintance be forgot etc".
Carbon footprint comparison?
We welcome your comments below. If you are not already registered, please register to comment
Remember we welcome robust, respectful and insightful debate. We don't welcome abusive or defamatory comments and will de-register those repeatedly making such comments. Our current comment policy is here.