

Here are the key things you need to know before you leave work today (or if you already work from home, before you shutdown your laptop).
MORTGAGE/LOAN RATE CHANGES
The Bank of China cut a range of fixed home loan rates.
TERM DEPOSIT/SAVINGS RATE CHANGES
At the same time, the Bank of China raised many TD rates, but not for 6 month offers.
CHANGE OF TUNE - NO APRIL HIKE
ANZ’s chief economist Sharon Zollner no longer expects the Reserve Bank to increase the Official Cash Rate above its current 5.50%. Although she is late to this change, ANZ's position is very influential. Money markets have priced that scenario for a few weeks now, in fact suggesting the OCR will next be cut in July 2024.
WORKER SHARE OF GDP
Today, Stats NZ updated some background GDP data. Even though it is only to March 2022, it helps us update a key economic relationship - the proportion of employee compensation to GDP. And it tells a partisan story. When Labour is in power, the share of GDP that accrues to workers rises. And it falls when National is the government. Over the past 20 years, the record is quite clear. Over the past 50 years it is broadly the same, although the Muldoon Government holds the distinction of when we had the largest fall. Click on the links to see the relationships charted. The data is from here. For reference, in the US it was 60%.
PRODUCER COSTS UP FASTER THAN COSTS IN SEPTEMBER QUARTER
Stats NZ also reported that output prices from producers rose +2.1% in the year to September, up +0.8% in the last quarter, while input costs rose +1.5% from Q3-2022 and up +1.2% from the June 2023 quarter.
MASSIVE SURPRISE
In August the US TIC flows were positive into the US by +US$62 bln. Expectations were that September's inflows would top that at +US$89 bln. But in the event there was a surprise outflow in September. The net foreign acquisitions of long-term securities, short-term U.S. securities, and banking flows was a net TIC outflow of -$67 bln. Of this, net foreign private outflows were -$62 bln, and net foreign official outflows were -$5.3 bln. That is a massive US$156 bln surprise in just one month.
SWAPS LOWER
Wholesale swap rates have probably retreated today. The real reaction will come at the close. Our chart will record the final positions. The 90 day bank bill rate is up +1 bp at 5.63% and now just +13 bps above the OCR. The Australian 10 year bond yield is down -11 bps from yesterday to 4.47%. The China 10 year bond rate is unchanged at 2.68%. And the NZ Government 10 year bond rate is down -15 bps from yesterday at 4.96%, and the earlier RBNZ fixing was at 5.18% which was also up +1 bp today. The UST 10 year yield is now at 4.44% and a -8 bps fall from this time yesterday. The UST 2yr is now at 4.84% so that key curve inversion is a little more at -40 bps.
EQUITIES SEARCH FOR WEEKLY GAINS
The NZX50 is down -0.6% in late trade today and heading for a very modest +0.2% weekly gain. The ASX200 is down -0.2% in afternoon trade and if that holds they will book a +1.0% weekly rise. Tokyo has opened up +0.3% heading for a +2.1% weekly gain. Hong Kong has opened -1.7% lower which would limit its weekly gain to +1.6%, and Shanghai has opened down -0.4% and will struggle to get even the current -0.1% weekly change to hold. Singapore has also opened another -0.7% lower. The S&P500 ended up +0.1% in Thursday trade on the S&P500, essentially hold the gains from earlier in the week and so far this week it is up +2.1%.
GOLD UP SHARPLY
In early Asian trade, gold is now at US$1983/oz and up +US$26 from where we were this time yesterday. Earlier in New York it was at US$1981/oz and earlier still in London at US$1980/oz.
NZD DROOPS
The Kiwi dollar is down -40 bps to 59.6 USc. Against the Aussie we are -20 bps lower at 92.2 AUc. Against the euro we are -½c lower at 54.9 euro cents. That means the TWI-5 is down -40 bps at 69.1.
BITCOIN RETREATS
The bitcoin price has pulled back today, now at US$36,432 and down -3.2% from where we were this time yesterday. Volatility over the past 24 hours has been moderate-to-high at just over +/- 2.9%.
Daily exchange rates
Select chart tabs
Daily swap rates
Select chart tabs
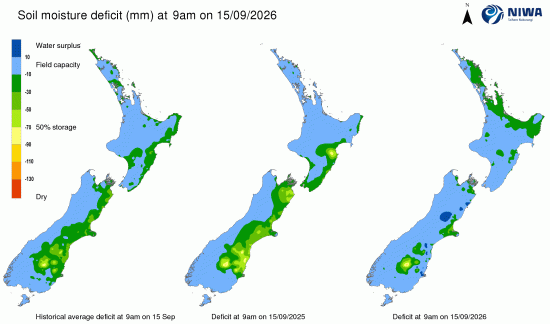
This soil moisture chart is animated here.
Keep abreast of upcoming events by following our Economic Calendar here ».
We welcome your comments below. If you are not already registered, please register to comment
Remember we welcome robust, respectful and insightful debate. We don't welcome abusive or defamatory comments and will de-register those repeatedly making such comments. Our current comment policy is here.