

This BNZ EcoPulse summary is re-posted here with permission.
Chart 1: A slowdown born in the USA
And breathe. After yet another test, global risk sentiment is back in recovery mode.
But while Middle East tensions may have eased, the global economy is still grappling with erratic US trade policy, and what it means for the outlook.
Global growth perceptions for both 2025 and 2026 have been knocked back, with downgrades centred on the US.
Forecasts have stabilised more recently. But next week’s expiry of the 90-day tariff pause looms as another test.
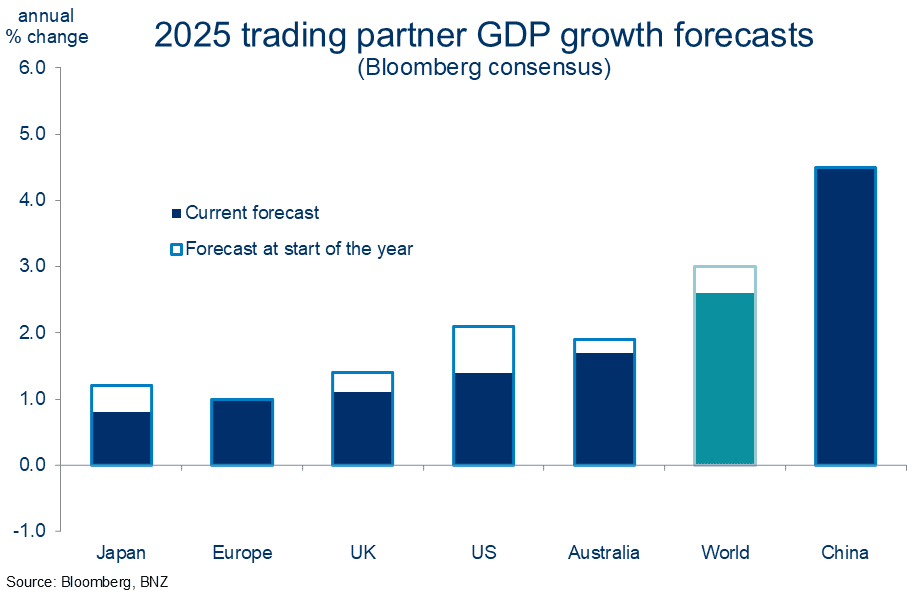
Chart 2: Trading places
The tariffs haven’t had a noticeable impact on NZ trade patterns in the two months since ‘liberation day’. It’s obviously early days.
May merchandise trade figures put NZ export values 10% ahead of last year, helped along by very favourable commodity prices.
The US crept a little further ahead of Australia as our 2nd largest export destination. It accounted for 13% of merchandise export values in the year to May.
There’s still daylight to China at #1.
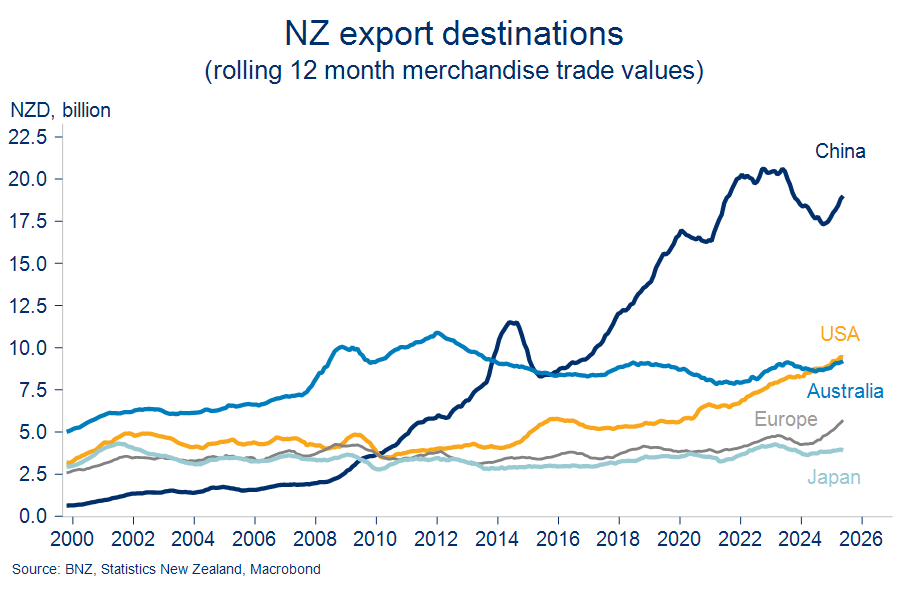
Chart 3: Mayday
It’s fortunate exports and the primary sector are doing their best to drag the economy out of the mire. Because some of the more domestically orientated sectors appear to be faltering.
There was a clear wobble in a whole range of indicators in May. But none more so than the Performance of Services & Manufacturing Indices.
Their deeper decline into contractionary territory was not in ‘the recovery’ script. It also leaves NZ again standing out amongst our global peers, and not in a good way.
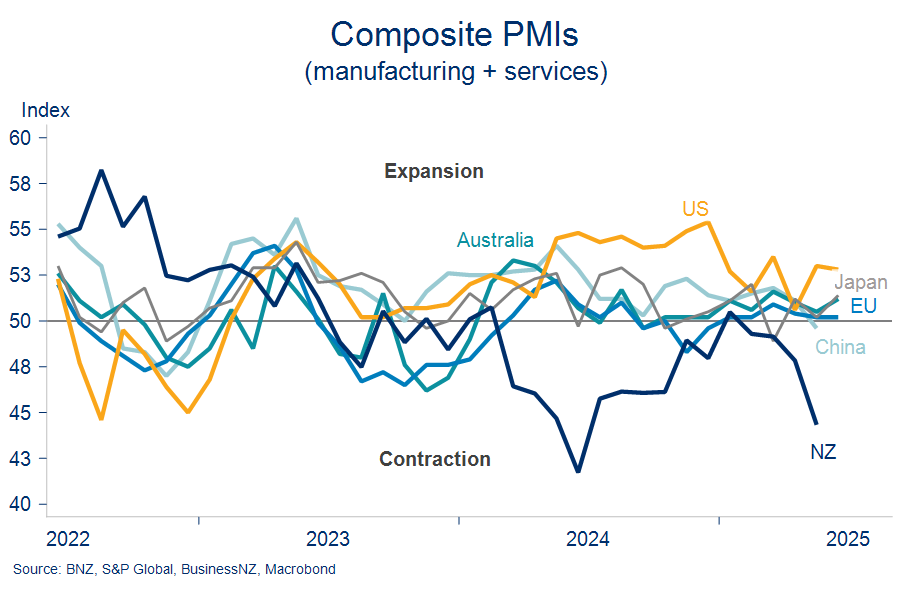
Chart 4: Retail therapy required
The failure of retail spending to fire has a lot to do with the stuttering nature of the recovery. Indeed, the retail sub-component was a clear underperformer in amongst the detail of the May PSI mentioned above.
To even say spending is flat may be overstating the case. The value of retail card spending in May was no higher than that of September 2022.
On a per-person basis, it’s still 6% below the 2023 peak.
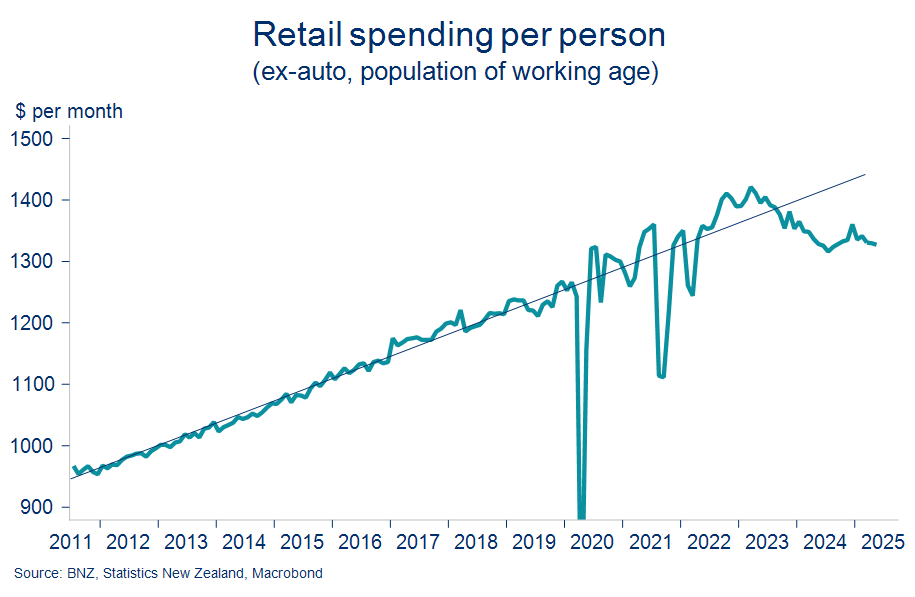
Chart 5: Dust settles on construction downturn
Construction is another important sector that’s been hit harder than most. But it increasingly looks as if the downtrend is done.
Residential construction volumes eked out a 2% expansion in the March quarter GDP accounts. That was the first such increase in seven quarters.
Moreover, the guidance from monthly building consents figures, including Tuesday’s reported 10.4% lift for May, is more sideways than down.
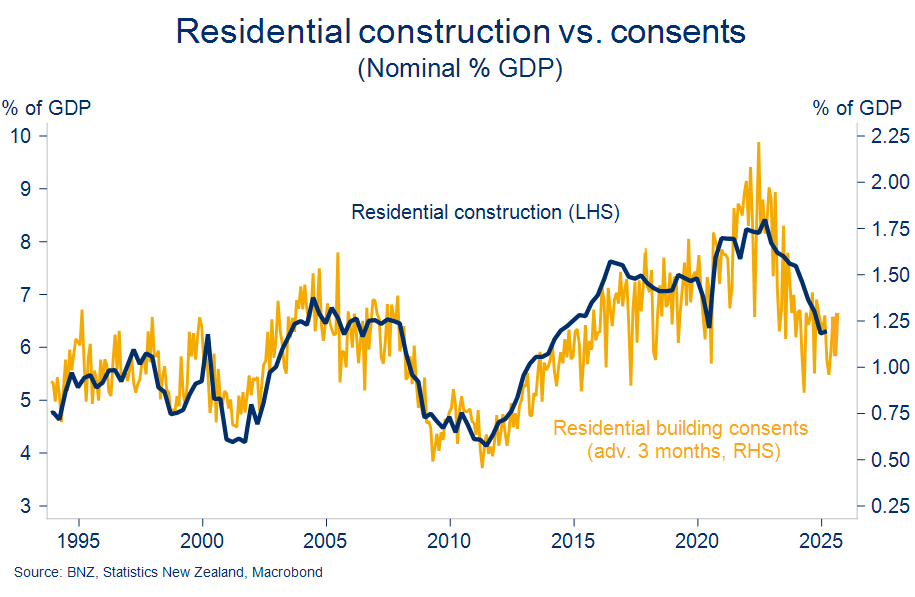
Chart 6: The only way is up
So it remains a multi-speed, fragile sort of upturn. Recent wobbles might dent the recovery, but they’re unlikely to prevent it.
The business community appears to agree. Optimism that brighter times are just around the corner persists.
Two of the better business activity leads from this week’s ANZ & NZIER confidence surveys held consistent with an implied lift in GDP growth to around 2.5% y/y.
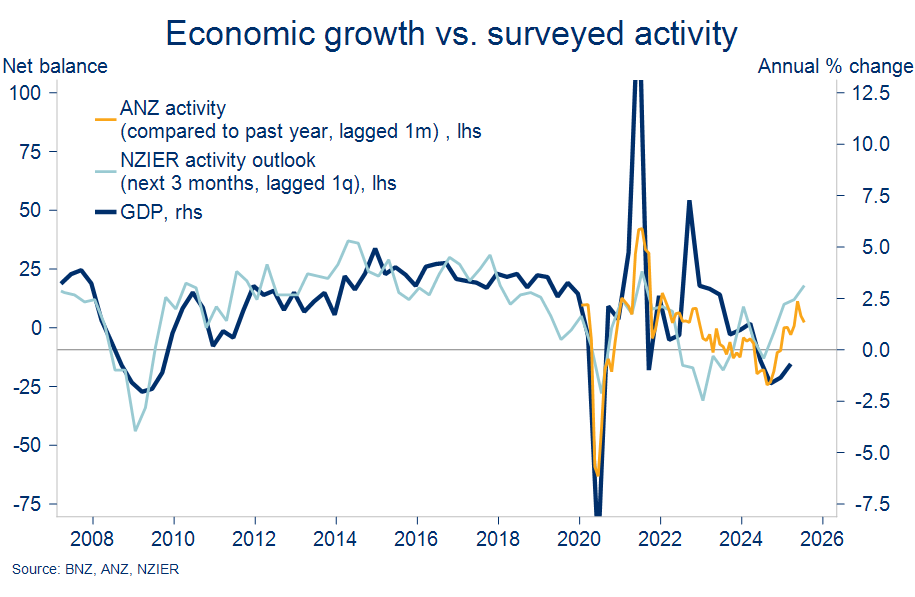
Chart 7: Hiring freeze
A steadying in economic momentum is the key precondition for firms to start acting on the positive employment intentions they’ve been reporting.
There have been scant signs of such to date. Filled jobs and job ads, for example, remain soft.
The latter are now at levels 50% below the 2022 peak and consistent with our forecast for a further lift in the unemployment rate to 5.3%.
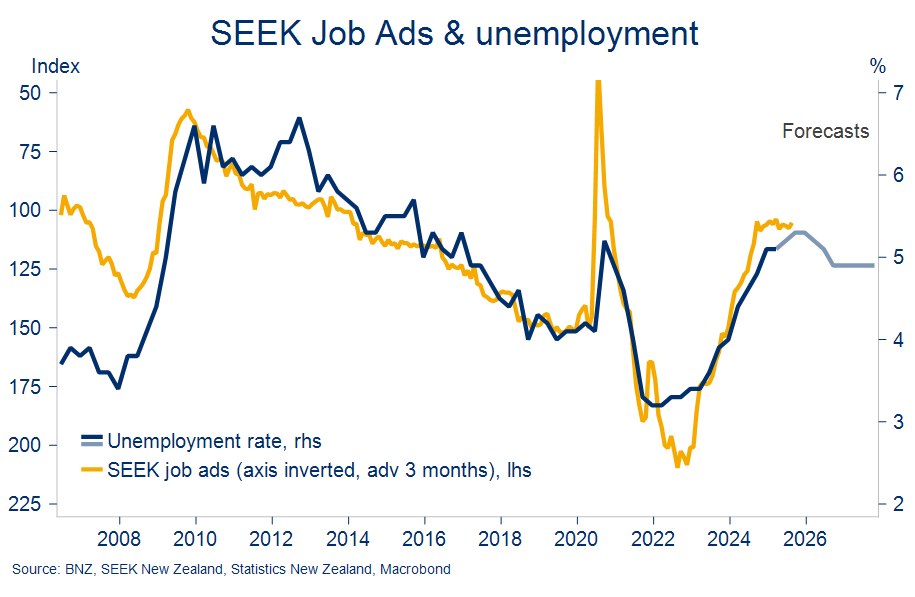
Chart 8: Pay slips
Fewer job vacancies spread across a growing population means competition for available jobs is intense. It’s one of many symptoms of an oversupplied labour market, something that continues to sap wage pressure.
The SEEK Advertised Salary Index slipped to 2.3%y/y in June. That’s lower than many of our trading partners and provides a strong signal next month’s ‘official’ wages data will record a similar nudge down in annual growth.
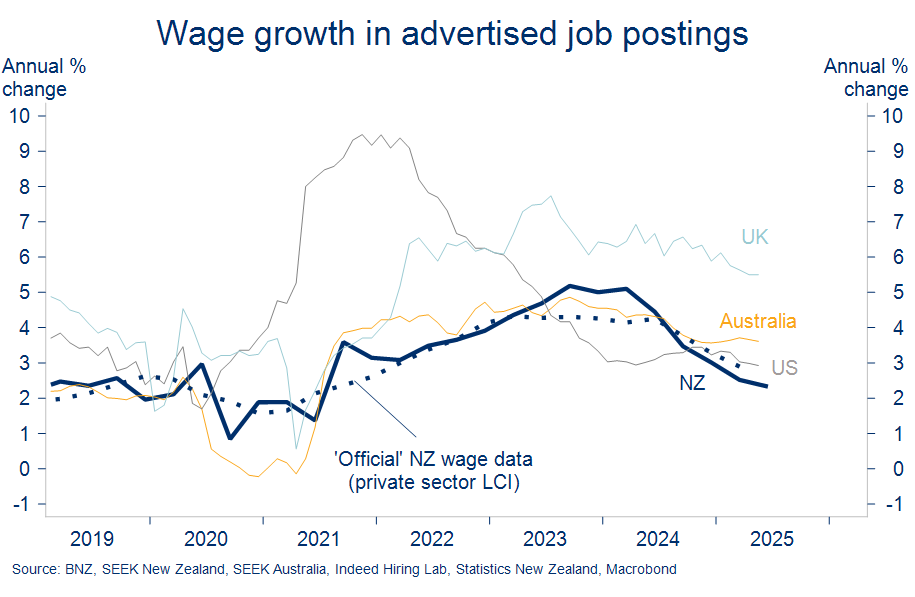
Chart 9: A nuanced inflation outlook
On our forecasts, inflation will soon threaten the top-end of the RBNZ’s 1-3% target range. But far from symptomatic of an overheating economy, the major contributors are rates, food, and energy.
Stymied demand means the underlying inflation pulse is weak. Hence inflation’s expected return to around 2% by mid-2026.
Two of the indicators from Tuesday’s NZIER business survey support this view of a barely-there underlying inflation pulse.
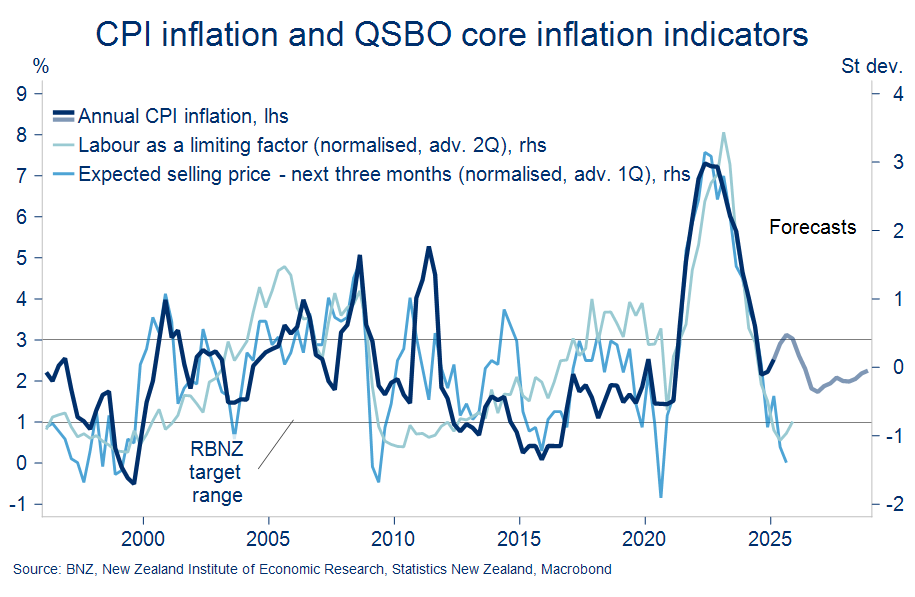
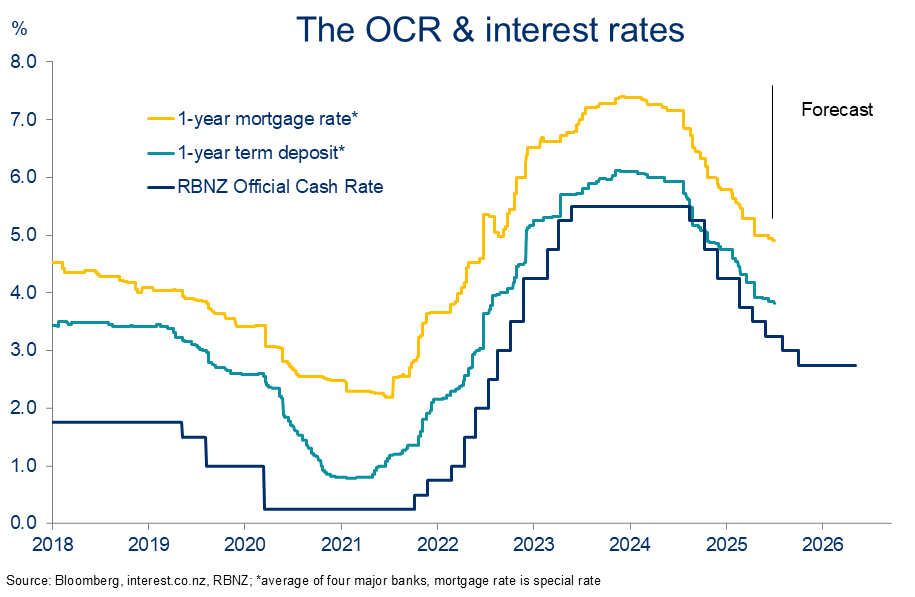
Chart 10: Downtrend’s last dance
To summarise, the economy needs a bit more help. We’ve thus retained our view the RBNZ’s Official Cash Rate will fall to a cycle low of 2.75%.
What we have changed is the phasing of the expected cuts. We now see a pause at next week’s RBNZ meeting, and an October low point.
Our broader view hasn’t changed: shorter-term retail interest rates have perhaps another 20-40bps of downside, but the bigger picture is we’re into the last dance of the downtrend.
Mike Jones is the BNZ Chief Economist.
17 Comments
The NZ government made significant reductions to the money supply in the NZ economy over the last 18 months through cuts to jobs and spending and sudden halts to planned investment.
The economy has contracted and stalled as a result - demand has been crushed and no-one in the private sector knows how to get it back.
Everyone at Treasury has read their Keynes text books and understands exactly what is happening. The economy will not recover until the government raises taxes and increases spending. Or even just increases spending now and increases taxes later.
Ah. The old credit card trick that brings happiness. What can go wrong?
In a fiat currency monetary the government creates and spends money first and taxes and issues bonds after that new money is circulating in the economy. Government bonds are not 'debt' they are private sector savings - basically term deposits for people like you and me to have safe harbor assets in our investment portfolios. The government does not borrow money by getting a loan from a commercial bank.
When the government needs to spend it does so by passing a budget in parliament and the reserve bank creates that money up front by typing it into reserve accounts for use by commercial banks to settle government spending into the private sector.
Taxes and bonds are used to withdraw money from circulation to prevent inflation - they are not used to fund government spending.
If you take a look at historic economic data for the last hundred years you will see that most advanced economies operate with government deficit and growing bond issuance. It's normal - government surplus is rare. These economies are still going strong - China, Australia, the US (up until they started cutting government spending), Japan (250% debt to GDP) still there, Germany, Canada etc.
None of them have collapsed or turned into Zimbabwe despite government deficit and debt supported economic growth.
None of them have collapsed or turned into Zimbabwe despite government deficit and debt supported economic growth.
Not yet, not so long as the world has faith in their currencies, which is slowly waning for the USA. I can make as many promises as my breath will allow, but it doesn't mean that I'll have the resources to fulfill them (time, energy, etc) to while I would eventually default on my promises also. the level of faith people have in my promises would be the value of them, as is with fiat currency.
When you look at NZ economic data from the 1980's onwards there is a consistent pattern - a center right government is elected and it cuts spending and taxes - the economy stalls or tanks and unemployment goes up. Government debt to GDP increases because tax revenue drops and welfare payments explode.
A center left government gets in and they increase spending and taxes - the economy grows and unemployment falls, tax revenues increase and debt to GDP starts to come down.
Government deficit spending underpins private sector growth - the government is the spender of first resort.
Most modern advanced economies would not let 800 business go into liquidation and over 12,000 jobs disappear in a single sector of the economy in12 months. Particular where that sector is building homes and infrastructure for the current and future population.
That much loss of productive capacity to NZ's economy in a population of 5 million - that looks like sabotage more than negligence or stupidity on the governments part.
Does retail spending include on-line purchases made overseas? Looking at the bulk figures, it's no wonder there are so many shuttered stores - and something that visible tends to weigh on the public awareness come elections.
And some greater granularity - more categories of spend - might allow at least a guess at if consumers have been figuring out that overseas online is a much better deal in the face of tightened times.
That retail spending per person looks extremely bad. So when is dropping rates (so that everyone can start drowning themselves in more mortgage debt) going to turn this around?
Worth a look at the real card spend per capita. Maybe it's the drowning that keeps us afloat?
Good charts, thanks.
Add in M2 money supply in a similar time series and you good a chocolate fish
Perhaps a chart on the decline of our natural resources, waterway's, biodiversity etc as well?
Oh that's right, economists don't place any value on that stuff.
Some much more important charts missing - jobs, benefits, flow of credit, current account deficit etx. Our economy relies on enough new money flowing from Govt and banks to overpower savings, loan repayments, taxation, and the flow of financial assets abroad. Amazes me that people look at random surveys rather than the basic macro facts.
You could write a banging article for this site JFoe given your propensity for graphs, stats and your observations. I'm sure I'm not the only one who would appreciate it :-)
Correct - NZ economic commentators don't understand macro-economics at all and think government is like a household. There is also zero awareness of how fiat currency monetary system operates in the real world. It's kind of scary when you think about how this influences fiscal policy and Willis is completely lost as a finance minister.
Chart 2 is worrying. Basically China owns us
Owns, or is simply the most receptive and profitable for us currently. I agree we have an overreliance on China, but reality is that we require international trade for our products to sell to and if we cannot convince other markets/countries to buy form us, what other choice do we have?
We welcome your comments below. If you are not already registered, please register to comment
Remember we welcome robust, respectful and insightful debate. We don't welcome abusive or defamatory comments and will de-register those repeatedly making such comments. Our current comment policy is here.