
By Peter Drennan*
Earlier this month I was perusing the articles on Interest.co.nz (as one does when avoiding actual work) and came across an article written by Terry Baucher on the subject of outstanding GST and PAYE obligations owed by New Zealand businesses. While not necessarily a topic that rises to the heights of the daily feed of US politics, for someone in the insolvency industry, it was prescient.
Terry's piece highlighted data surfaced through an Official Information Act request covering total GST and PAYE outstanding, along with various permutations including aging and industry breakdowns. For me, the data was fascinating, and Terry's arguments about the apparent unfairness of how the Inland Revenue prioritises enforcement were well made.
At a high level, this data should always be a concern. IRD enforcement activity is the match that lights the fuse for a vast majority of New Zealand's insolvency events. Obviously there are general principles of fairness at play when some taxpayers accumulate significant obligations while others experience enforcement for seemingly lesser transgressions (Terry's article articulates these concerns brilliantly).
But I wanted to take a closer look at the data and figure out what these numbers are really telling us from my perspective in the trenches of the insolvency industry. This article is my humble attempt to do exactly that. Just how big a problem is this for New Zealand businesses? And more importantly, what's coming down the pike?
Understanding the data scope
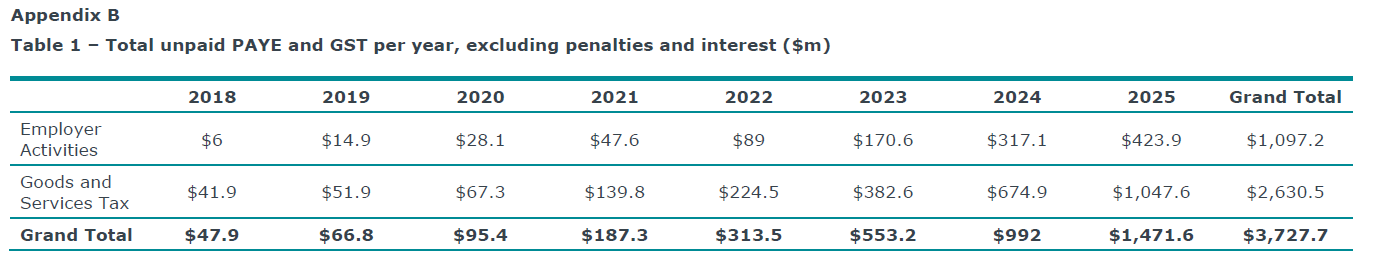
The IRD's figures capture a specific type of non-compliance: PAYE that was actually withheld from employees' wages and GST that was charged to customers, but then not passed on to IRD. Think of it as the corporate equivalent of spending your flatmate's rent money, except the flatmate is the government, and they have statutory powers. Obviously there are other tax types at play that aren't in the dataset, but also (and this is crucial) these PAYE and GST amounts exclude penalties and interest.
The data presents an aged analysis of unpaid debt for the period ended 31 March 2025, as at 31 May 2025. This snapshot is perhaps misleading at first glance: it doesn't really give any context as to whether these totals have actually increased. Are we looking at a rising tide or just the usual high-water mark? As this is a single point-in-time snapshot, we don't really get a sense whether this backlog is growing in the aggregate, or whether having this aged debt overhang is simply business as usual. Since this isn't a standardised dataset we can't definitively know, but we can answer the aggregate question by piecing together point-in-time snapshots from other IRD datasets.
Below is data I've cobbled together from other IRD data sources (not from the OIA report) showing estimated unpaid GST and PAYE debt as at 31 March of each year. Note that these totals are higher than the OIA data as they include interest and penalties.
The escalating burden
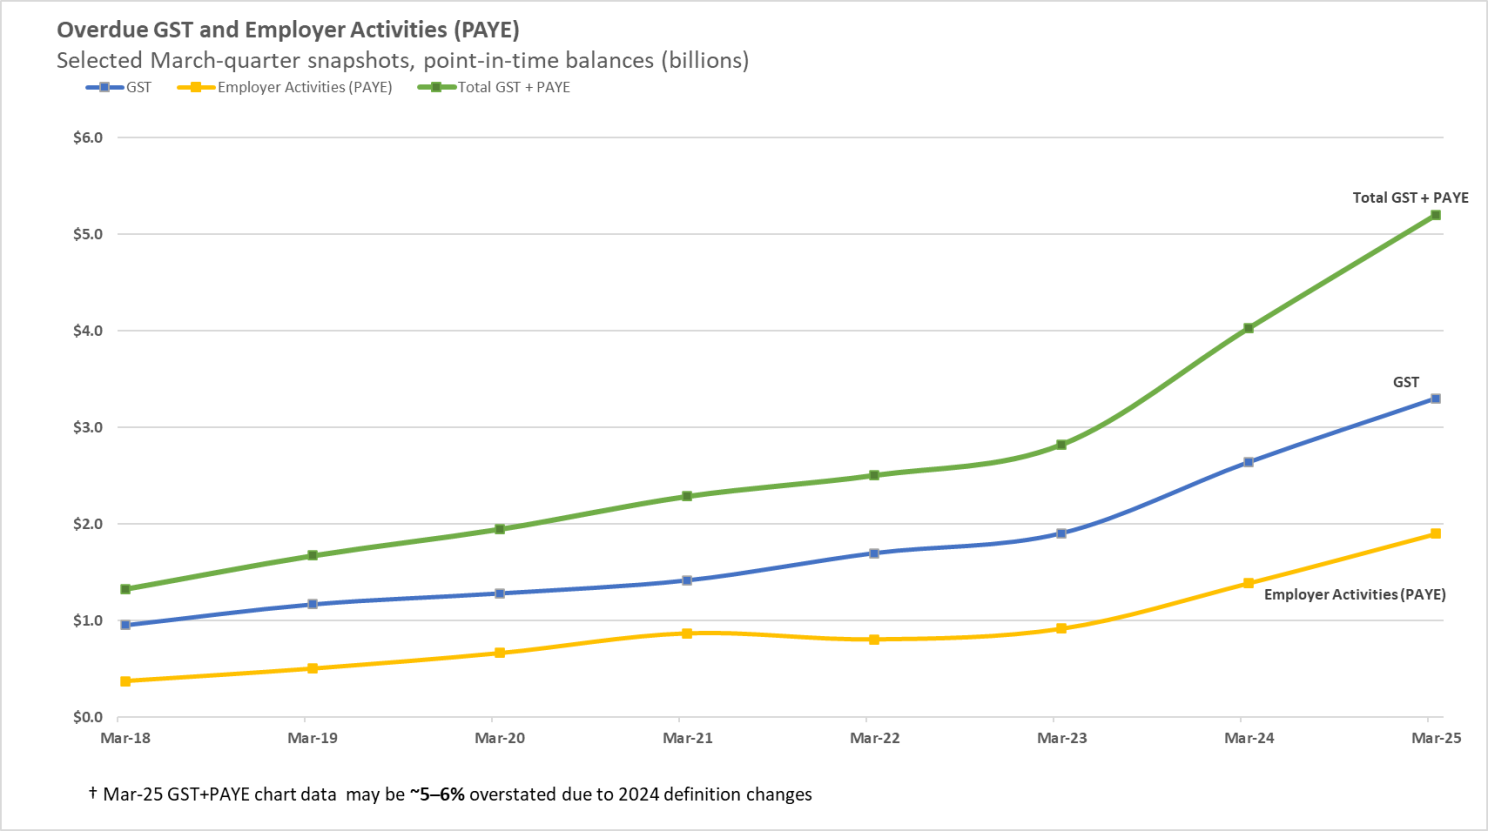
March-quarter snapshots reveal a steady climb in overdue balances since 2018, with particularly sharp increases from 2023 onward. The trajectory here is telling: we're not looking at a gentle slope but rather something approaching a steady uphill climb. Critically, the 2025 figures show no signs of improvement despite broader economic stabilisation efforts.
The persistence of this trend into 2025, even as interest rates begin to ease, suggests the problem has developed its own momentum independent of the initial triggers.
The insolvency connection
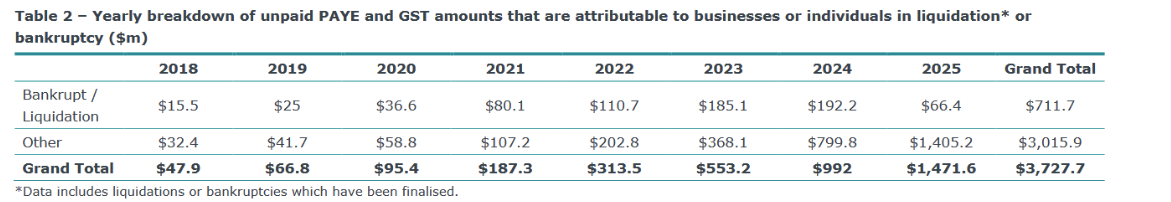
Terry's article briefly discusses that $711m of the $3.7b in the OIA data is attributable to insolvent estates, but here's the critical point that might not be immediately obvious: this only includes finalised liquidations and bankruptcies. As anyone in the insolvency industry will tell you (usually over their third coffee of the day), liquidations can drag on for years. All collection steps, including investigation and litigation, must be completed before a company is finally struck off. So for me, this data is an extremely lagging indicator. It's like looking at last year's weather forecast to plan tomorrow's picnic.
Of more immediate interest is the IRD data on collectable versus non-collectable debt. This categorisation appears to include current insolvencies (a crucial distinction) and represents the best indicator we have for how much road is left to run for insolvency appointments. That number? $1.1b, or for those without a calculator handy, 29% of the total. This means 71% is still sitting out there on the balance sheets of Kiwi businesses: a sword of Damocles waiting to drop.
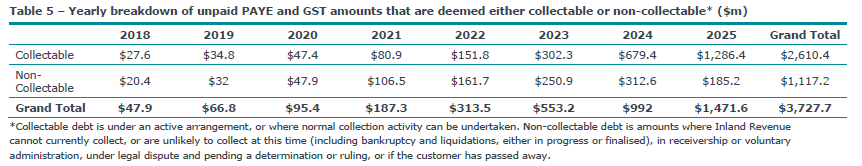
The 2025 non-collectable figure of $185 million raises interpretive challenges. Since this data covers only through 31 March, a simple annualisation would project $555 million for the full year, a 77% increase from 2024's $312.6 million. More likely, however, is that prior years' non-collectable amounts will continue rising as companies with historic IRD debts enter liquidation, making any straightforward projection problematic.
Industry concentration and vulnerability
The industry breakdown reveals pronounced concentration of tax debt across New Zealand's economic sectors. Construction dominates with approximately $1 billion in outstanding obligations as at 31 March 2025, far exceeding any other sector. This isn't just leading the pack; it's lapping the field.
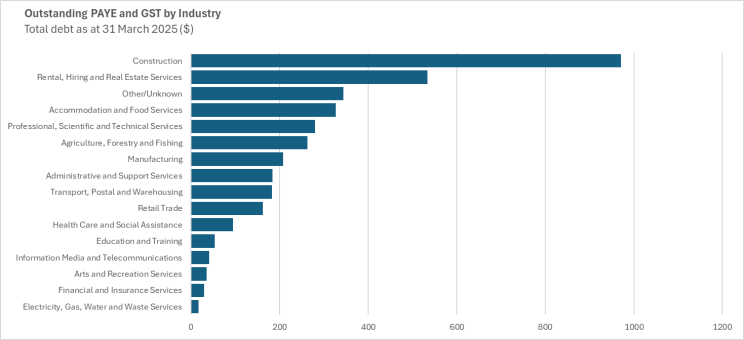
Rental, Hiring and Real Estate Services follows as the second-largest contributor at roughly $500 million. Accommodation and Food Services carries around $325 million (reflecting the ongoing challenges in hospitality, where margins were thin even before COVID made them translucent). Professional, Scientific and Technical Services sits near $275 million, while Agriculture, Forestry and Fishing rounds out the major debtors at approximately $250 million. Manufacturing, Administrative and Support Services, and Transport, Postal and Warehousing each hold between $150-200 million in unpaid obligations.
At the lower end of the spectrum, we have industries dominated by large public companies and sectors resilient to cyclical downturns: your utilities, your telecommunications, the businesses that keep ticking regardless of economic weather.
But these raw numbers cry out for context. One way to add perspective is to examine these figures with reference to employment. Using Statistics New Zealand's industry employment data, we can get a sense of how these industry figures compare on a per-employee basis.
The Per-Employee Perspective
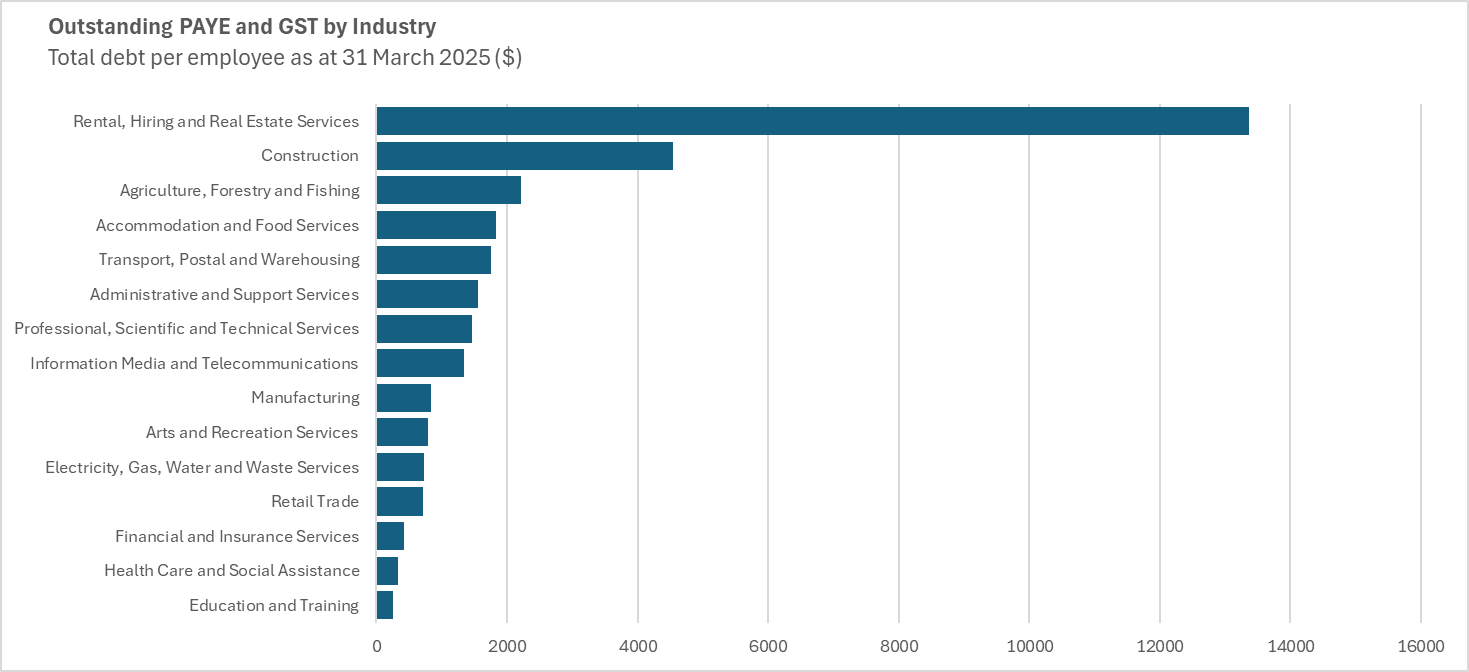
Examining these totals through the lens of workforce size fundamentally shifts the picture of sectoral vulnerability. Rental, Hiring and Real Estate Services emerges as an extreme outlier, with approximately $13,000 in unpaid tax per employee. That's not a typo: thirteen thousand dollars per person employed in the sector.
Construction's per-employee burden of roughly $4,500 confirms that its massive absolute debt isn't merely a function of the absolute size of the sector. This intensity metric indicates genuine financial stress rather than just scale effects. It's not just big, it's genuinely troubled.
Agriculture, Forestry and Fishing at $2,200 per employee is perhaps surprising given the relatively buoyant dairy sector (milk powder prices have been holding up reasonably well). This possibly reflects inequities within that category. The dairy farmers might be doing fine, but what about the forestry contractors? Transport, Postal and Warehousing also shows elevated per-employee debt in the $1,700 range, suggesting these sectors face similar cash flow pressures.
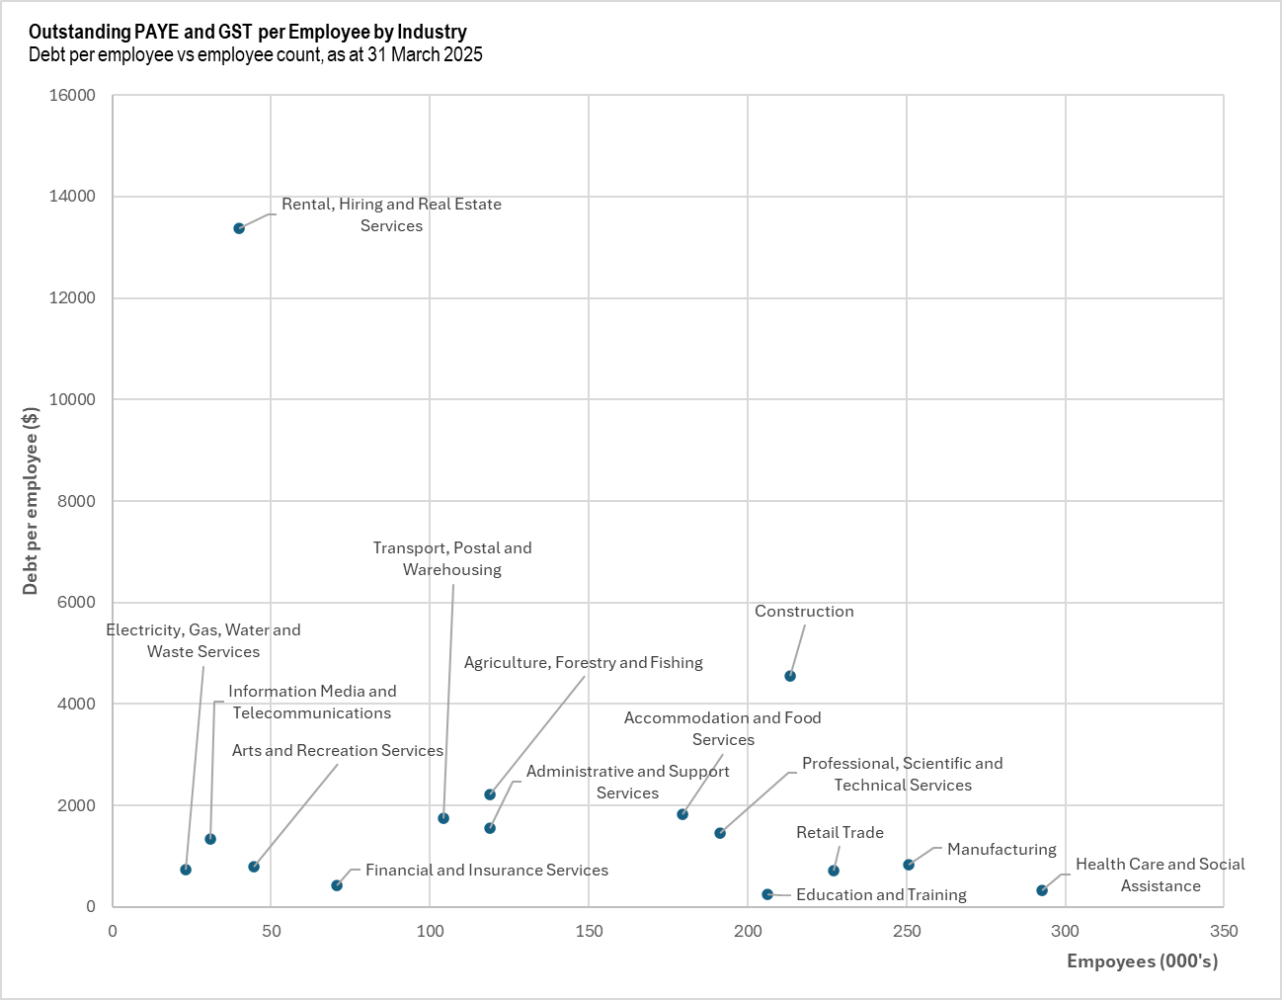
Now, these per-employee calculations require careful interpretation (there's always a caveat, isn't there?). GST obligations correlate with business turnover rather than employment levels, making headcount an imperfect denominator, particularly for capital-intensive or high-turnover sectors. The metrics also don't distinguish between full-time and part-time employment patterns, which vary significantly across industries. But even with these limitations, the data illuminates why the construction industry is so critical to the wider New Zealand economy: it employs a lot of people, and right now each of those employees represents about $4,500 of outstanding GST and PAYE obligations (and that's before we even count interest and penalties).
Interpreting the patterns
The data reveals a clear story of sector-specific distress linked inextricably to New Zealand's property market correction. The post-COVID surge in property values through 2021-2022 (remember when everyone thought house prices only went up?) gave way to a sharp downturn as interest rates rose. This left industries with direct exposure to real estate and construction particularly vulnerable, caught between the rock of declining revenues and the hard place of accumulated obligations.
This vulnerability manifests not just in the IRD data but more directly in insolvency statistics. Company liquidations in 2024 reached their highest levels since the 2008 Global Financial Crisis, with construction and property-related firms heavily overrepresented. History doesn't repeat, but it certainly rhymes.
The timing dynamics suggest worse may be yet to come (and I don't say this lightly). IRD debt enforcement typically lags defaulted tax obligations. There's a grace period, then warnings, then payment arrangements, and only then enforcement. With the property downturn accelerating through 2023 and 2024, the full impact on tax compliance and insolvencies may not yet be reflected in data ending March 2025.
Even with recent interest rate easing (the OCR has come down, offering some relief), the accumulated debt burden creates its own momentum. Enforcement actions trigger insolvencies, which cascade through subcontractor networks, creating further defaults. It's a domino effect where each falling piece is someone's livelihood.
In the construction sector particularly, there's a tendency for businesses to take on new projects to generate cash flow for old obligations, robbing Peter to pay Paul, as the saying goes. This strategy works only if market conditions improve. With residential construction consents down sharply and commercial property vacancy rates elevated, these businesses may find it increasingly difficult to navigate these choppy waters. You can only bail water for so long before the boat goes under.
Looking Forward
The convergence of several factors points to continued stress. The IRD's enforcement activity, having been relatively restrained during and immediately after COVID (remember the "be kind" era?), appears to be intensifying. The very high per-employee debt burdens in real estate services and construction suggest these sectors have little remaining capacity to absorb further pressure. The elastic has been stretched to its limit.
As payment arrangements fail and "collectable" debt transitions to "non-collectable" status, I expect to see insolvency numbers for 2025 exceed even 2024's post-GFC highs. Property-exposed industries will bear the brunt of this adjustment, but the ripple effects will continue to spread. When construction companies fail, they take suppliers with them. When property services struggle, professional services feel the pinch.
What does this mean for the broader economy? Well, $3.7 billion in outstanding tax obligations represents money that should be circulating through government services but instead sits frozen in a standoff between struggling businesses and an increasingly assertive IRD. That's not just a number on a spreadsheet; it's hospitals, schools, and infrastructure that might have been.
For those of us in the insolvency industry, the message is clear: buckle up. For business owners carrying IRD debt, the window for voluntary restructuring is narrowing.
Peter Drennan is a practising lawyer and leads Waterstone’s Christchurch office. Waterstone specialises in recovery and insolvency work and provides consulting and advisory support to companies in financial distress or considering turnaround strategies.
8 Comments
Great article. Thanks for the dive below the surface.
Appreciate the analysis. Another damning realisation of how tied up our economy is in never ending capital gains and the behaviours that this has ingrained over the last 35 years. As much as we wish for affordable housing, and long may it continue to correct accordingly, this article shows the real flow on effects.
Hopefully the IRD uploads the defaulters to the credit agencies. Would allow punters to avoid people like Kitchen Things and Jones Group etc. Most of the defaulters are insolvent long before they flop over and just expose other people's money before the bach, boat and BMW gets sold up.
Great article, thanks. The analytical detail is enlightening. Your use of language makes the content accessible and understandable.
How many of those in construction gathering PAYE and GST and not passing it on to the IRD, are still driving around in a Ford Ranger?
Rrrrranger!
The mechanics dream: Another transmission gone....and another.....and another.
Thanks for a great article. It would be interesting to see a graphed comparison between the insolvencies etc compared to the GFC era. Still a lot of water to flow under the bridge yet I suspect. Not exactly something a lower OCR will fix either.
Examining these totals through the lens of workforce size fundamentally shifts the picture of sectoral vulnerability. Rental, Hiring and Real Estate Services emerges as an extreme outlier, with approximately $13,000 in unpaid tax per employee. That's not a typo: thirteen thousand dollars per person employed in the sector.
The huge gap in the per employee stats between RE services and the next highest (construction) for that outlier is amazing. I assume (?) there are a magnitude more employees per construction entity, than there are in RE Services entities. Related turnover by sector would be another interesting stat to have a look at.
What I can't figure out is what the RE Services sector's outgoings are - such that they got so far behind in these payments? I wonder if it is the commission agents that themselves got behind; or whether it is the business franchisees that got behind? Or both. It doesn't make sense given it seems yoy RE commissions paid seem to go up and up industry wide.
Perhaps my assumption is all wrong and it's the Rental and Hiring (as opposed to RE Services) sectors that make up the bulk of these late payments.
We welcome your comments below. If you are not already registered, please register to comment
Remember we welcome robust, respectful and insightful debate. We don't welcome abusive or defamatory comments and will de-register those repeatedly making such comments. Our current comment policy is here.