
By Amanda Morrall
Official savings records don't exactly cast New Zealanders in a positive light.
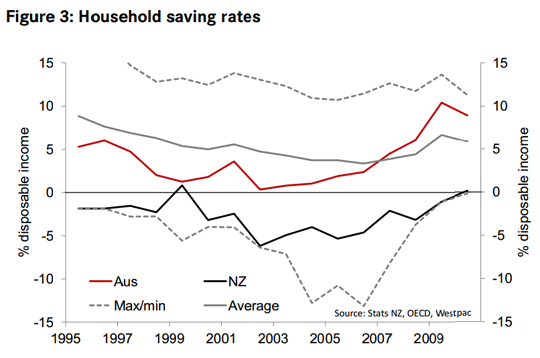
According to this housing savings chart below, from the Organisation for Economic Cooperation and Development (OECD), we'll just narrowly beat out Denmark and Finland for a last place finish in 2013 with a savings rate of 1.6.
But are we really as bad as all that, chronically spending beyond our means, saving nothing for a rainy day let alone retirement?
Westpac senior economist Felix Delbrück doesn't think so.
His reasons for rejecting the standard line about Kiwis' not saving enough, relative to the rest of the world, have to do with the way savings rates in New Zealand are calculated and he identifies weaknesses when it comes to measuring income data needed to assess savings.
|
|||||||||||||||||
| 2006 | 2007 | 2008 | 2009 | 2010 | 2011 | 2012 | 2013 | ||||||||||
| Australia | 2.4 | 4.5 | 6.1 | 10.4 | 8.9 | 9.7 | 9.6 | 9.1 | |||||||||
| Austria | 10.4 | 11.7 | 11.5 | 10.7 | 8.3 | 7.5 | 7.5 | 7.5 | |||||||||
| Belgium | 10.8 | 11.4 | 11.7 | 13.7 | 11.2 | 11.2 | 10.5 | 9.5 | |||||||||
| Canada | 3.5 | 2.8 | 3.9 | 4.6 | 4.8 | 3.8 | 3.3 | 3.0 | |||||||||
| Czech Republic | 6.1 | 5.7 | 4.8 | 6.1 | 5.7 | 4.2 | 3.9 | 4.3 | |||||||||
| Denmark | -2.3 | -4.0 | -3.7 | -0.4 | -0.2 | -1.3 | -0.9 | -1.8 | |||||||||
| Finland | -1.1 | -0.9 | -0.3 | 4.1 | 4.1 | 2.2 | 1.4 | 0.6 | |||||||||
| Germany | 10.8 | 11.0 | 11.7 | 11.1 | 11.3 | 11.0 | 11.0 | 10.6 | |||||||||
| Hungary | 7.2 | 3.3 | 2.7 | 4.5 | 2.5 | 3.0 | 3.2 | 3.7 | |||||||||
| Ireland | -0.9 | -0.1 | 5.5 | 10.1 | 8.9 | 9.4 | 8.3 | 7.3 | |||||||||
| Italy | 9.5 | 8.9 | 8.4 | 7.1 | 5.3 | 4.5 | 4.3 | 4.5 | |||||||||
| Korea | 5.2 | 2.9 | 2.9 | 4.6 | 4.3 | 3.1 | 2.9 | 3.1 | |||||||||
| Netherlands | 6.1 | 6.9 | 5.9 | 6.4 | 3.9 | 5.5 | 6.4 | 7.0 | |||||||||
| New Zealand | -8.9 | -4.0 | -4.5 | -2.2 | 0.1 | 0.8 | 1.3 | 1.6 | |||||||||
| Norway | -0.5 | 0.8 | 3.4 | 6.6 | 6.1 | 8.0 | 8.9 | 7.6 | |||||||||
| Poland | 6.1 | 4.6 | -0.3 | 6.8 | 6.4 | 3.9 | 4.7 | 4.9 | |||||||||
| Slovenia | 11.7 | 10.3 | 9.4 | 9.1 | 10.0 | 9.0 | 7.6 | 5.7 | |||||||||
| Sweden | 4.9 | 7.2 | 8.9 | 11.2 | 8.5 | 9.7 | 10.7 | 9.4 | |||||||||
| Switzerland | 11.4 | 12.6 | 11.7 | 12.0 | 9.9 | 11.4 | 12.1 | 12.0 | |||||||||
| United States | 2.6 | 2.4 | 5.4 | 5.1 | 5.3 | 4.7 | 4.3 | 4.0 | |||||||||
Using a different model, that includes data on household assets and liabilities, our household savings rate isn't so dissimilar from Australians, whom according to the OECD, are on track to have a savings rate of 9.1.% of disposable income for 2013.
This "alternative measure", lies in stark contrast to the official, more widely reported data and charts that show a negative savings rate for the last 15 years.
In Delbrück's report "Save Us!: How much are New Zealanders really saving", models using the alternative measure show New Zealanders were saving around 8% of their disposable income in 2010. That compares with the official measures that tags saving rates at 0%.
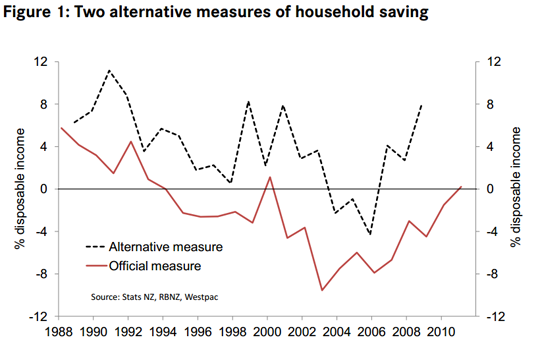
While the alternative measure paints New Zealand households in a more favourable light, Delbreck is quick to point out its shortcomings as well. Problems with both models mean it's impossible to state, with any accuracy, just how much and at what rate New Zealanders are actually saving. In general terms, Delbrück believes that our reputation has been somewhat maligned.
"In principle they both have issues but it (the alternative measure) avoids some of those problems with measuring income and says we're not as anomalous with our savings rates compared to some other countries as the official measure might suggest," he told interest.co.nz.
He makes the same point in his report.
"Importantly, one measure isn't obviously better than the other, they just use different (and differently flawed) data sources to get at the same concept,'' he writes.
"As much as anything, the gap between them (the official and alternative methods of calculating savings) highlights the unknowns around saving, and the need to treat any overly confident comments about saving with caution. We can't say how much saving 'needs' to increase if we don't know what it is today.''
Can we construe from this that New Zealanders can afford to relax a bit on the saving front?
Delbrück stops short of saying as much.
"We just look a little bit more normal I think," he said, adding that "There's a lot we don't know about savings."
"It's easy to hone in on one particular measure that tells the story you want to tell but maybe we shouldn't be quite as alarmed as the official measure that that red line in the chart suggests."
We welcome your comments below. If you are not already registered, please register to comment
Remember we welcome robust, respectful and insightful debate. We don't welcome abusive or defamatory comments and will de-register those repeatedly making such comments. Our current comment policy is here.