
Here's our summary of key economic events over the weekend that affect New Zealand, with news of major releases of data from China and the US.
First up, China recorded its fewest births in 58 years in 2019, with them down to +14.7 mln, and lower by -580,000 than in the previous year according to official data. Their population has just nudged 1.4 bln people, a rise of just +0.3% in 2019. Their working aged population is 64% of the total and that is very similar to the New Zealand makeup.
China also reported that its economy grew +6.1% in 2019 ending the year with Q4 growth slightly lower at +6.0% which was the same expansion at Q3. A slew of other December data was released at the same time showing industrial production was up at the rate of +6.9% in December and that was the second highest month in 2019. In contrast, coal and oil production hardly rose at all, but electricity generation was up +3.5%. (Many see this electricity growth data as a better reflection of actual economic activity.) Fixed asset investment - another key economic marker - rose +5.4% in December. Retail sales were up +8.0% in December compared with the same month in 2018.
Fast economic growth and no population growth will mean China is making quick gains in per capita income levels. And while the percentage growth gains may be slowing, the absolute gains are holding.
And China reduced its one year prime lending rate by -10 bps to 4.05% over the weekend. It reduced its five year prime rate to 4.70%. Both were -5 bps lower than the market was expecting. It might be reducing lending rates, but it definitely not allowing any movement on term deposit rates which are stuck at 1.50% for one year and 2.75% for three years - as they have been since 2015.
Balancing the generally positive Chinese data however have been generally weaker American announcements.
Updated data from the US shows that China is letting its investment in US Treasury bonds atrophy. For each of the past six months, Japan has been the largest holder, and the Chinese holding has fallen by -US$32 bln or -2.9%. At this rate, Chinese holdings will fall below US$1 tln some time next year.
Housing starts in the US took off in December, up +40% from the same month a year ago, which admittedly was unusually weak. But it may be a short-lived boost - building permits for residential construction are starting to tail off from recent rises although they are still +6% higher than a year ago.
American industrial production wasn't so flash however, coming in a full -1% lower in December 2019 than December 2018. There are many sectors with large declines, and without gains in IT and especially defense spending, their manufacturing sector would have been in a crisis situation.
Job openings are shrinking, and actually shrinking fast. They fell more than -7% in November from October, and are down -11% in a year.
Despite that, consumer sentiment remained virtually unchanged in early January, differing by just -0.2 Index-points from December.
On Friday we reported that the Atlanta Fed's GDPNow calculation has economic growth shrinking to just +1.8% pa for Q4-2019, a fast retreat. Today we can reveal that similar tracking by the NY Fed has it even lower at +1.2% pa.
One of the most interesting data comparisons is between the real dollar GDP growth between China and the USA. Based on the official data released by each country, the American annual rise in 2019 was +US$388 bln, a remarkable -32% less than the +US$569 bln rise in 2018. That compares with the real 'dollar' rise for China in 2019 which was almost exactly the same level in 2019 as in 2018 - or a bit over +US$800 bln in each of the past two years. History will record that the tariff wars hurt the Americans much more than the Chinese. Washington is blind to this failure, as much as Beijing is blind to the unsustainability of their current policy direction. But at the moment, China is definitely winning a bigger expansion of their economy than the Americans.
The Australian bush fire news is seriously undermining their tourism industry. An internal survey conducted among its 850 members of the country's peak export tourism body showed that 70% of them were seeing a lot of cancellations from their big key markets – America, Britain and China. They estimate the cost is -NZ$5 bln already and things are likely to worsen from here.
The UST 10yr yield is exactly where it was at this time last week at just under 1.83%. Their 2-10 curve has moved little, now at +26 bps. Their 1-5 curve is flatter at just +6 bps. And their 3m-10yr curve is also little-changed at +29 bps. The Aussie Govt 10yr is at 1.18% and very similar to where it was a week ago. The China Govt 10yr is marginally lower at 3.13%. And the NZ Govt 10 yr is up +6 bps for the week at 1.55%.
Gold is now at US$1,557/oz and almost exactly the same level as a week ago.
US oil prices are also little changed, now just on US$58.50/bbl and the Brent benchmark is just over US$64.50/bbl.
The Kiwi dollar is now at 66.1 USc and a broadly similar level to this time last week. On the cross rates we are at 96.1 AUc. Against the euro we are at 59.6 euro cents. That puts our TWI-5 at 71.4 and almost the same level it was this time last week.
Bitcoin is down -3% from where we left it on Saturday to US$8,624 although it is up +6% from this time last week, and up almost +20% since the start of the year. The bitcoin rate is charted in the exchange rate set below.
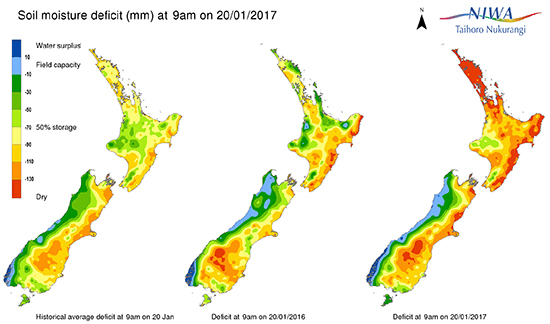
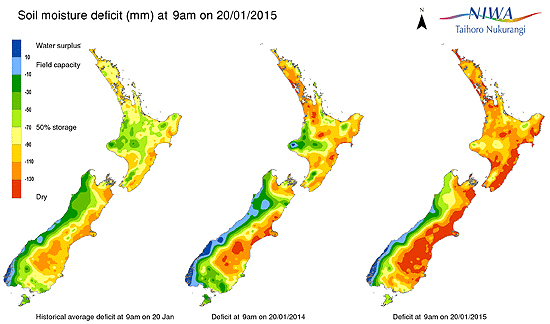
And here are the 2015 and 2017 maps for easy reference:
The easiest place to stay up with event risk today is by following our Economic Calendar here ».
We welcome your comments below. If you are not already registered, please register to comment
Remember we welcome robust, respectful and insightful debate. We don't welcome abusive or defamatory comments and will de-register those repeatedly making such comments. Our current comment policy is here.