

One of the great recent innovations from the data wonks at the Reserve Bank has been their mortgage market reconciliation, C35.
There is a lot of data around that reveals key aspects of this market, but C35 ties it all together.
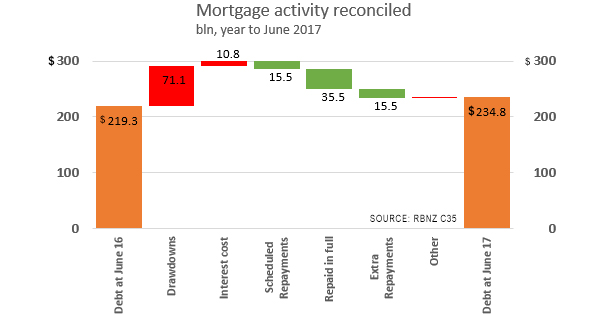
In the year to June 2017, banks charged (earned) $10.8 billion on a mortgage book that averaged $227.4 bln over the period. That is an average interest rate of 4.75%, which you have to say is surprisingly low. That is down from 4.91% in the year to March 2017. It would be easy to assume it would have been a little higher than that given that many borrowers would not have been able to score the best rates on offer for a whole series of reasons.
Our average in the same year across two year fixed carded rates was 4.64%, those for one year was 4.51% and for floating was 5.65%. To get a system-wide average of 4.75% must have involved substantial discounting from carded rates for most prime borrowers.
Borrowers benefit
So the conclusion can only be, banks competed hard on price and almost all borrowers benefited from that competition.
To give the scale of the consumer benefit, in the previous year to June 2016, they charged $11.5 bln in interest at an average rate of 5.46%. In the year to June 2015, the interest charged was also $11.5 bln at an average rate of 5.88%.
Home loan borrowers saved $0.7 bln in interest costs in a year.
That made payments easier to make - so house buyers bid up prices. And took on more debt, on the basis the payments were 'affordable'.
"Loan drawdowns have been rising" ... er, that may have been the assumption, but it turns out it wasn't true. In the year to June 2017, these drawdowns amounted to $71.1 bln which is down from $75.4 bln in the previous year which was the highwater mark. The rate of loan drawdown started to decline in the June 2016 quarter and have been steadily slipping since then.
And then there is the rate at which we are paying these mortgage loans back. Believe it or not, we have been upping our regular (scheduled) repayments. The just under $4.0 bln repaid in the June 2017 quarter is the highest in this RBNZ data. (And that is true even if you adjust the data for the tiny level of repayment 'deficiencies' recorded in the system.) That is $15.5 bln in scheduled repayments in the full year.
Who would have thought?
But borrowers make more than just scheduled repayments - and those additional repayment levels may well surprise you. Regular, scheduled repayments are $15.5 bln per year, but other excess repayments are almost as much, and amounted to just under $15.5 bln in the year to June 2017. Apparently, on average, borrowers are making actual repayments at twice the rate they are required to in their loan documents. Who would have thought?
And before you ask the question, those additional repayments do not include paying off the full loan when you shift from one borrower to another (or when you make that final payment to become mortgage free). Those types of repayments are captured separately in this RBNZ data reconciliation. Those 'repay in full' amounts total $35.5 bln in the year to June 2017. Interestingly, that is the lowest annual rate since September 2015, which suggests that we are not switching institutions at the rate we once did. Lenders are doing a much better job of retaining clients even when faced with competitive pressure. This behaviour also supports the tightening of the interest rates charged.
Knowing this data for mortgages allows us to derive what banks are doing with lending for loans other than for mortgages.
| year to March 2017 | Interest charged |
Mortgages (average) |
Other loans (average) |
Rate (average) |
| $ bln | $ bln | $ bln | % | |
| - ANZ (GDS and G1) | 6.234 | 65.189 | 50.855 | 5.37 |
| - ASB (GDS and G1) | 3.988 | 49.527 | 25.682 | 5.30 |
| - BNZ (GDS and G1) | 3.767 | 35.166 | 40.651 | 4.97 |
| - Kiwibank (GDS and G1) | 0.826 | 15.968 | 1.313 | 4.78 |
| - Westpac (GDS and G1) | 3.974 | 44.838 | 30.888 | 5.25 |
| - All others (difference) | 2.325 | 9.391 | 14.862 | 9.21 |
| Total interest charged by all banks (S21) | 21,114 | 220.079 | 164.251 | 5.49 |
| Total mortgages (C35 and G1) | 10.805 | 220.079 | 4.91 | |
| All other lending (difference) | 10.310 | 164.251 | 6.28 |
Banks may be incentivised by the capital adequacy rules to prioritise lending for mortgage lending, but there is no getting away from the fact that home loan borrowers have benefited from this by being offered lower interest rates - and those benefits are substantial.
We welcome your comments below. If you are not already registered, please register to comment
Remember we welcome robust, respectful and insightful debate. We don't welcome abusive or defamatory comments and will de-register those repeatedly making such comments. Our current comment policy is here.