

How investors relate to benchmark bonds in secondary markets is the economic canary-in-the-mine.
Investors signal their intentions through the yield they will buy or sell such bonds. As a group, they arbitrage variances and watch the curves.
A yield curve is a line that plots the interest rates, at a set point in time, of bonds having equal credit quality but differing maturity dates. The most frequently reported yield curve compares the two year and ten year government debt. This yield curve is used as a benchmark for other debt in the market, such as mortgage rates or bank lending rates, and it is also used to predict changes in economic output and growth.
The shape of the yield curve gives an idea of future interest rate changes and economic activity.
There are three main types of yield curve shapes: normal, inverted and flat. A normal yield curve is one in which longer maturity bonds have a higher yield compared to shorter-term bonds due to the risks associated with time. An inverted yield curve is one in which the shorter-term yields are higher than the longer-term yields, which can be a sign of upcoming recession. In a flat (or humped) yield curve, the shorter- and longer-term yields are very close to each other, which is also a predictor of an economic transition.
As has been noted before, New Zealand's place in the global economy is quite specific. We are a suburb of Australia who is a province of China, the main supplier of consumer goods to the vast global economic engine that is the American middle class. Their political leanings may seem a bit odd but they have massive buying power. And that drives economies that are highly interrelated.
The American middle class demand (as represented by US retail sales) is growing in a healthy basis, but another engine is rising; the Chinese retail market. This year it will surpass the American one in absolute size even if the per capita metrics still greatly favour the Americans. But what has been a trade from China to satisfy the Americans will now change and be increasingly diminished as China's demand keeps on rising. Given both are at the same size now, you can get an indication of the way things will change by understanding the American retail market is growing at +4.2% per year nominal while the Chinese one is growing at +10% per year. The change will transition quickly.
So from a New Zealand policy and economic point-of-view, we need to watch both economies closely because these trends will affect us. Watching doesn't mean we approve of what either is doing politically or economically, but the only advantage we have in our tiny size is specialisation and nimbleness in the face of their enormous size.
Firstly lets look at the recent trends in the benchmark bond yields of all three economies. Investors have applied the lowest risk premiums to US Treasuries. Rates have been stable all through 2017 as the US Fed came to grips with how it would taper its quantitative easing. Now that is embedded, investors see rising inflationary risk in the long term, not only from the populist fiscal turn and its implications for a sharp growth in long-term debt levels, but because the underlying economy is improving especially on the jobs front, and the long-awaited wage pressure is finally evident. Skill shortages and rising demand will be inflationary and investors see higher interest rates long in to the future. They are starting to respond; and if bond prices start to fall, all the more reason they need a higher return. And if the US Treasury comes to market for more funds they will need to entice investors with higher rates.
Since September, these rates have risen +75 bps.
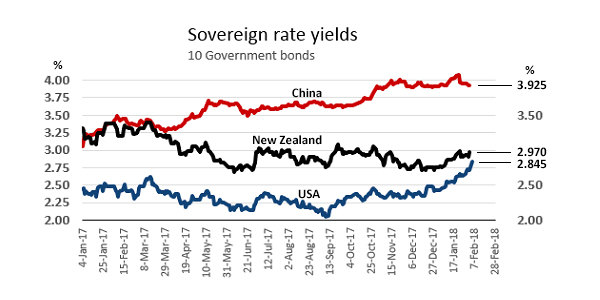
China's rates are harder to articulate because officials actively manipulate markets. But markets are growing and more and more debt is being held in the open secondary markets. And these markets have bid up yields +70 bps since the beginning of 2017. Investors are getting to accept that China is successfully transitioning to services and consumer demand, away from command fixed asset investment, and that is making them more comfortable. Still, investors still want at least 100 bps above US equivalent rates for the 'interference' risk.
New Zealand is different to both. We are not seeing significantly rising rates yet. But by implication investors are very happy with the relative fall in rates compared to both the US and China. Demand remains strong for NZGBs and credit default swap premiums are bumping along at historically low levels. The signal seems to be that current prices fairly reflect the low risk the New Zealand economy poses. If you take the 10 year bond as an indicator if risk, the premium between the NZ and US rates has never been lower and it is at such a level now that a discount seems entirely possible. That is, the US poses more investment risk requiring higher rates than New Zealand. Odd, but the charts reinforce that possibility.
But there is more to this story than just rate levels. As we noted above, rate curves tell their own stories.
You can look at these curves as a way to see what markets are signaling about the future. A flat curve suggests investors see the future as 'more of the same'. The interest rates for short and long durations give a fair premium for the time-value of money.
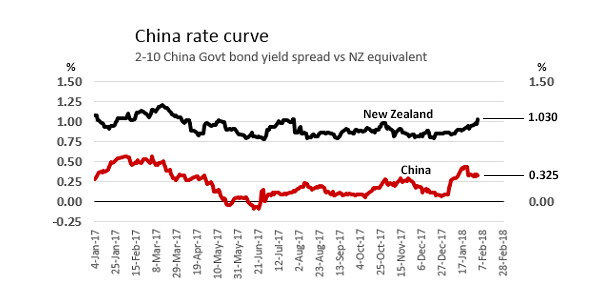
Interest rate inversions - where investors want higher returns now because they see short term risk more challenging than long term investment - suggests coming economic troubles. Chinese markets started suggesting that in mid 2017 and when Chinese officials noted the signal, there was an unusual sudden 'correction', to the signal that The Party is trying to impose. These markets are large however and investors aren't usually fooled by such manipulation, although they will happily take the government's mis-pricing pressure. But when it became clear that the investment-to-services transition is a real thing, peace broke out. Having said that the 2-10 premium is tiny and indicates well-founded lingering scepticism.
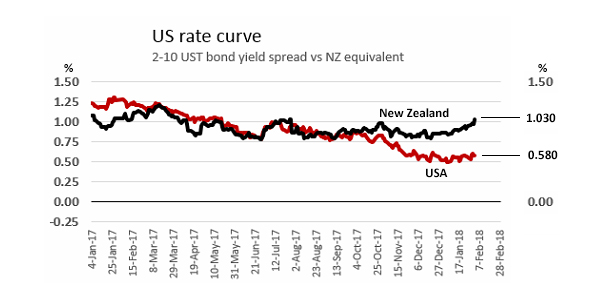
Perhaps even more sceptical are investors in the new, odd American markets, where policy makers are trying to replace basic economic wisdom with bluster. The 2-10 yield curve is on a downward track reinforcing that scepticism. In simple terms, investors may be accepting higher rates but they want sharply higher short term rates for the sudden new short term risks.
Are market signals always right? Of course not. Crowd wisdom is based on what they know today. If the underlying facts change, market signals can (and do) change. Equity market signals tend to focus on the very short term 'crowd wisdom' while bond market signals tend to focus on much longer views. Even so, bond market signals can realign even if they don't have a habit of doing so quickly. One of the longest bond market signals is the UST 30yr yield. This one is ignoring today's rapid changes, remaining entirely sceptical.
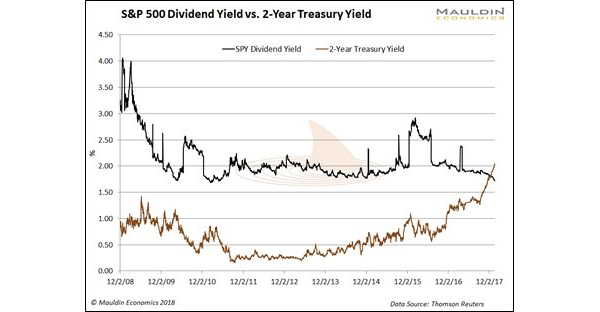
And here is something else. The S&P500 dividend yield is now below above the UST 2 year yield for the first time since August 2008.
We welcome your comments below. If you are not already registered, please register to comment
Remember we welcome robust, respectful and insightful debate. We don't welcome abusive or defamatory comments and will de-register those repeatedly making such comments. Our current comment policy is here.