

This is a re-post of the Special Topic in the Treasury Monthly Economic Indicators report for April 2019.
Productivity measures how efficiently production inputs, such as labour and capital, are used in an economy to produce outputs, or goods or services. Productivity growth is a key driver of incomes and higher incomes, both at a household and country level, enable greater financial wellbeing and affordability of higher living standards, such as improved healthcare and education.1
Statistics New Zealand have recently released new annual productivity statistics, for the year to March 2018, that cover the measured sector of our economy. The measured sector covers around 80 percent of the New Zealand economy and excludes those sectors, particularly government services, in which productivity is difficult to measure. These estimates therefore differ to economy-wide productivity data used in some publications.
This Special Topic will discuss recent trends in labour and multifactor productivity (MFP) growth and capital deepening. Labour productivity refers to the quantity of goods and services produced in an economy per hour of labour worked:
• Multifactor productivity (MFP)
The quantity of goods and services produced per unit of capital and labour input.
• Capital deepening
The increase in capital per hour worked
MFP reflects the overall efficiency with which labour and capital inputs are used together in the production process. MFP is unobservable and so measured as the residual growth in output unaccounted for by the growth in capital and labour input. Changes in MFP reflect the effects of changes in a number of unobserved inputs, which can range from management practices and organisational change to general knowledge, economies of scale and measurement error.
Capital includes buildings, machinery and equipment, including ICT equipment. Capital investment can improve labour productivity by allowing more output to be produced with the same labour input. Capital investment also has spill over effects that improve MFP growth e.g. new equipment may require workers to learn new skills or require improvement to work practices.
Together, increases in capital per worker and increases in the efficiency with which both labour and capital are used will increase labour productivity.
Latest estimates show New Zealand’s productivity growing at a slower rate
Labour productivity and MFP in the measured sector both increased in the year to March 2018, but at the slowest rate since 2009 when the impact of the Global Financial Crisis (GFC) led to falls in productivity.
Labour productivity grew by 0.3 percent in the year ending March 2018, while output grew by 3.2 percent. Output grew at a much higher rate than labour productivity as there was a large increase in hours worked of 3.0 percent. MFP also grew by 0.3 percent in the same period.
Productivity growth can be volatile year-on-year and so productivity performance should be considered over a period of time. Since 1996, labour productivity growth has averaged 1.4% per annum and MFP has averaged 0.8%. Over the last decade, annual averages are 1% and 0.6% respectively, suggesting productivity has slowed in recent years.
Capital deepening consistently contributing less to productivity growth
As can be seen in Figure 13, since the GFC labour productivity growth has been almost completely driven by growth in MFP as there has been little change in capital per hour worked. Prior to the GFC, investment and subsequent growth in capital was greater than the growth in labour input and the capital-labour ratio grew.
Figure 13: Decomposed annual labour productivity growth 2009 - 2018, market sector, annual percentage change
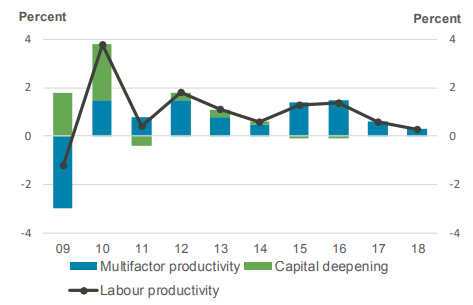
SOURCE: STATISTICS NZ
Since the GFC, both capital and labour have grown at a similar rate, while the growth in the capital to labour ratio has plateaued, as seen in Figure 14.
Figure 14: Capital and labour input growth, market sector, 1996=1000
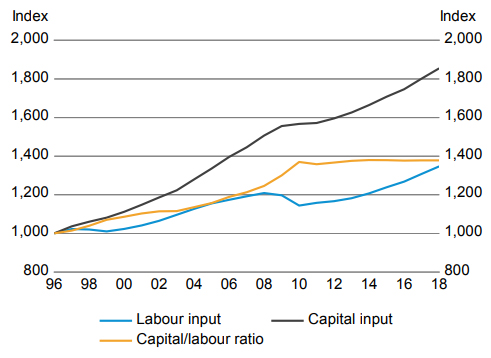
SOURCE: STATISTICS NZ
New Zealand’s productivity performance in an international context
New Zealand’s labour productivity growth has kept up up with that of OECD countries over recent years2. However, the level of labour productivity has been below the average of high-income OECD countries for some time and has not caught up.3
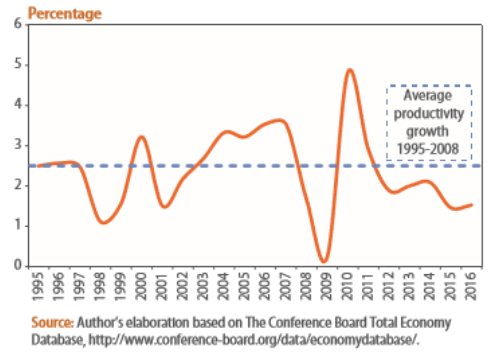
Globally there has been a widespread and persistent slowdown in productivity growth across advanced, emerging, and low-income countries following the GFC.4 The United Nations (2017) describe the slowdown in productivity growth following the GFC as being one of the most prominent features of the world economy in recent years.5
Declining MFP growth and weak capital investment are considered the main contributors in advanced economies for low productivity growth relative to precrisis trends (IMF, 2017). However, causes of the slowdown are highly debated and other causes could include slowing technological progress, slowing international trade and changing demographics.
Over reliance on the labour market as a driver of economic growth is also considered a factor in New Zealand. Since 2000, our labour market growth has been more than twice the OECD average3. Whilst a strong labour market is important for many outcomes, including incomes and wellbeing, sustained employment growth, together with relatively weak capital investment can lead to weaker labour productivity and MFP growth.
Issues with productivity measurement are also frequently discussed and although there is general consensus that the global slowdown is not wholly a measurement issue, difficulties in measuring new services and outputs (such as those relating to the so-called Gig-economy) could also be contributing to the slowdown, as these activities may not be accurately captured in output measures.
Figure 15: Growth of labour productivity in the world economy, 1995 – 2016 (UN, 2017)
Labour productivity growth is expected in the future
Whilst forecasts are subject to uncertainty, both RBNZ and the Treasury predict labour productivity growth to return to just over 1 percent per annum by 2021.6 These measures refer to the whole economy rather than just the measured sector as examined in the official productivity data above.
The Treasury expect that firms will adjust to recent increases in labour input and capacity constraints with higher capital investment and that this steady investment growth, combined with lower labour supply growth, will lift the capital-to-labour ratio.
The Treasury will update its forecast in the Budget Economic and Fiscal Update 2019, published on 30 May 2019.
Notes:
1. The Productivity Commission provide a more detailed explanation about why productivity is important and the Treasury’s Living Standard Framework explains what is meant by living standards.
2. Discussions about international comparisons and predicted productivity growth relate both to market and non-market sectors.
3. Paul Conway (2018) “Can the Kiwi Fly? Achieving Productivity Lift-off in New Zealand”, New Zealand Productivity Commission
4. International Monetary Fund (2017) “Gone with the Headwinds: Global Productivity” IMF Staff Discussion Note
5. United Nations (2017) “The Slowdown in Productivity Growth: A View from International Trade” Development Issues No. 11
6. RBNZ Monetary Policy Statement 2018 and the Treasury HalfYear Economic and Fiscal Update 2018
1 Comments
This statement is opening statement totally misleading
"Productivity measures how efficiently production inputs, such as labour and capital, are used in an economy to produce outputs, or goods or services. Productivity growth is a key driver of incomes and higher incomes, both at a household and country level, enable greater financial wellbeing and affordability of higher living standards, such as improved healthcare and education.1"
Higher productivity doesnt lead to higher incomes and well being. It only does IF the labour force is given those increases.. which it has not.
This whole premise is based on the assumption higher capital increases production and therefore the economy.
Any increase in production will fail if the local markets dont have the disposable incomes to purchase those products and services..
In resent yrs we have maintained/increased production by increasing demand by increase population, that has resulted in a reduction of disposable incomes...the "financial wellbeing and affordability of higher living standards, such as improved healthcare and education"
Each of these have examples below
With the long term stagnation of the middle income wage and salaries, we are now seeing some of these groups jump up and down.. even strike. Things that have not happened for almost a generation.
Doctors, nurses, teachers.
We are also seeing housing not being affordable to the section of the population that has historically been the main driver of homes.
DHBs schools government services running into funding problems more often and more seriously bad.
Not only that.. we are blaming system failures rather than failures caused by the lack of proportional income growth over the last 30/ 40yrs of the middle income sector.
Example teacher shortage and issues to recruit new teachers locally, high rates of Police turn over.
Bottom line it comes down to the balance between income and the job. Both of these and many other like middle income professions are no longer attractive to ente into, OR stay in.
Result is in For example teaching, a far lower standard of teachers, and a emphasis on training, retraining. And we have seen the result of that sort of in house direction with the LTSA.
Basically we are trying to PATCH a system of stagnated or falling productivity failing disposable income by population increase, tax cuts, subsidies to the lower middle income, and now proposed here , capital investment..
lower interest rates is a tradition method of increasing demand/ productivity, but not much room to move there, and throw in any increase in income will neutralised by debt.. and the same for any tax breaks.
Bottom line if banks, companies and the governments are serious, it is a change to the balance of the wage salary income within the population..
I.E move to more of a the middle 50% of wage earners get approx 50% of the wage salary take..
Increases demand, increases tax take, better heath education services.
Down side this is best done during good growth times, not when productivity growth reduces.
Doing so, well we can look back on the 1930s or 1950s even the 1970s to see the economic and social upheaval that results.
Government policy gone wrong..
We have a teacher shortage..we have near enough teachers that have left the profession, retired early to bring back by putting the cost of the new drive into wage increase, and tie that wage to fixed hrs, actual hrs worked..
income fixed, education fixed productivity in the fried fixed , tax take fixed.
We welcome your comments below. If you are not already registered, please register to comment
Remember we welcome robust, respectful and insightful debate. We don't welcome abusive or defamatory comments and will de-register those repeatedly making such comments. Our current comment policy is here.