
• House prices rise when not enough houses are available to meet resident and non-resident demand, and when low interest rates and income growth allow people to bid up prices.
• Recent price declines in Australia have led some to suggest Auckland will follow. But Australia has over-built relative to its population growth over the last decade, as it over-developed for a foreign investor market that is now weaker.
• Auckland has not, which has implications for the relative outlook for the region’s largest cities.
• With Auckland’s economic outlook, prices will likely remain flattish, with limited macroprudential risk, and slow gains in affordability.
Auckland’s flat house prices
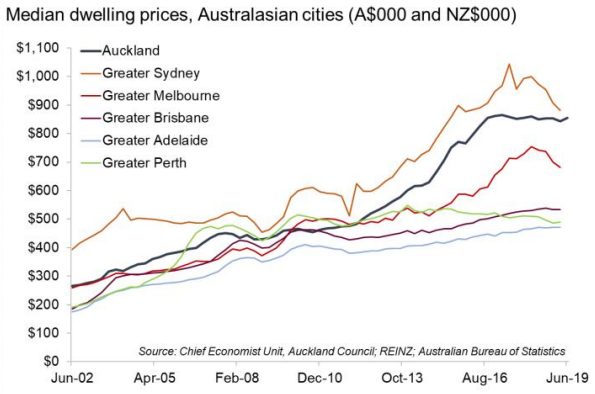
The Auckland Unitary Plan, aided by tighter exchange controls in China and loan-to-value restrictions on investors in New Zealand, reduced land prices by about 6% in Auckland over the two years to 2018. The Unitary Plan was introduced on 15 November 2016, enabling four times the city’s previous housing capacity. The impact of this surge in development potential was immediate and irrefutable, although limited. Auckland house prices fell about 4.5% from their peak in October 2016, to their nadir in February 2017, staying flat since then.
In March 2019, the threat of a capital gains tax took Auckland prices down another (small) step. But with capital gains now off the table, we’ve seen a small resurgence in house prices in this city.
Boom. Splat.
Melbourne and Sydney, meanwhile, saw house prices peak between June 2017 and March 2018. Since then, prices have fallen 15% and 10% respectively. Perth prices have fallen 11% since the end of the mining boom. Brisbane prices have recently flattened out, while Adelaide prices have risen most modestly and uniformly.
The Sydney and Melbourne stories have prompted all sorts of prognostications on whether Auckland house prices will follow, often with little empirical evidence to support the view.
Mixed population growth across cities
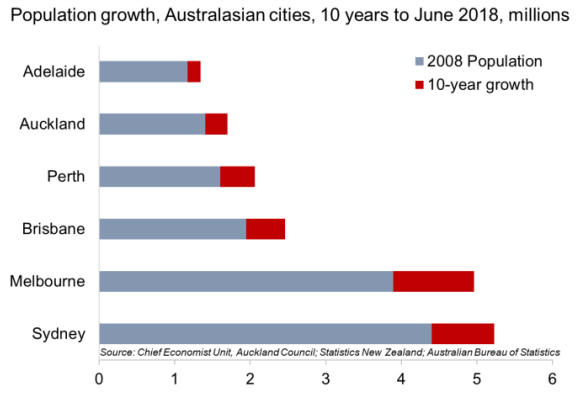
While local and international sentiment undoubtedly plays a role in house prices, these Australian cities have overbuilt relative to population growth when compared to Auckland, meaning they just don’t have the housing shortfall Auckland does. This puts them at far greater risk of the kind of price falls they are currently experiencing.
Since 2008, Auckland has grown by 290,000 people, or two Taurangas. Adelaide has grown more slowly in absolute and percentage terms. Brisbane has grown almost twice as much, Sydney by almost three times as much, and Melbourne more than three times as much. In percentage terms, Perth has grown fastest, even though it is now growing more slowly on the back of a weaker mining sector.
Australia has massively out-built Auckland
So have these major cities responded to this growth by delivering more housing?
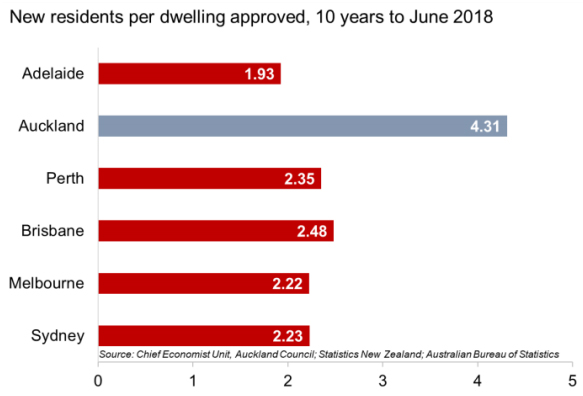
Dwellings approved don’t perfectly reflect what was built and when, but they are a good proxy. Over the 10 years to June 2018, Auckland consented 67,400 new dwellings. Adelaide, with its weaker population growth, consented 90,100. Melbourne consented 482,000, seven times Auckland’s figure.
A couple of Auckland caveats are worth mentioning. First, this lacklustre growth is stunted by the first three years of the decade of analysis, which saw almost no building activity in Auckland; annual dwellings consented in June 2018 were up 260% on the average between June 2008 and 2011. Second, annual new dwellings consented in Auckland have risen a further 12% since June 2018, while falling across Australian cities.
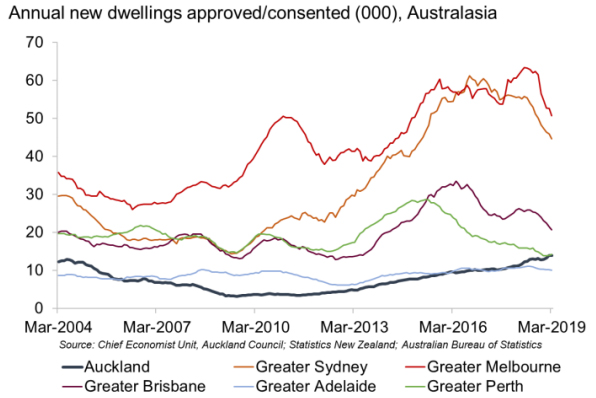
But the percentage decline in Australian cities through the GFC was less severe than in Auckland (where approvals fell 60%). All Australian cities saw a much faster bounce-back in building activity than Auckland, which lagged through to 2011.
How appropriate are these levels of building?
World-wide, the trend is toward smaller numbers of people per dwelling as demographics change. This means even if your population growth is stagnant, you’d need to add to your housing stock slowly. But population growth matters more than population size as the primary driver of demand for more housing in rapidly-growing cities.
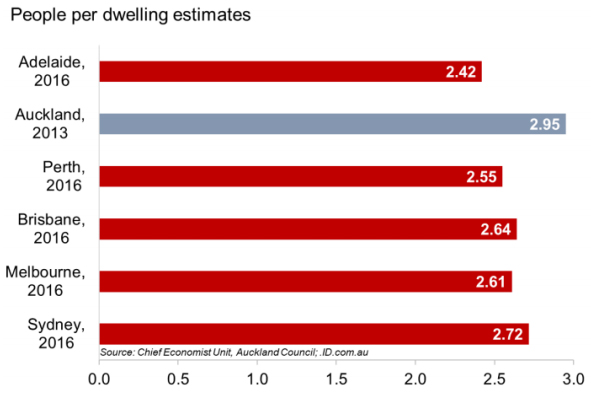
As of the mid 2010s, all six cities had an average number of people per dwelling between 2.4 and 3.0. Auckland already had the highest figure after a period of weak building activity and with its population beginning to surge.
Yet the difference in rates at which housing was consented across cities, relative to actual new residents, is astounding (see figures overleaf). Auckland’s 4.31 new residents per dwelling is far higher than the ratio for the existing population. Meanwhile in Australia, all five cities have built faster than the ratio for their existing populations, meeting the needs of growth and then some.
This suggests (and nervousness at some Australian banks with regard to funding apartments bears this out) that Australia has overbuilt on the back of demand to park foreign money in newbuild properties there.
With that demand weakening, there is now an oversupply of housing, and some of it catering for a very specific segment of the market.
Adelaide is an exception probably worth looking at in more detail in future. It has fewer people per dwelling (an older population) but has built at the fastest rate relative to population growth. It has a housing mix more skewed toward stand-alone homes than Sydney and Melbourne, and greater stability in the number of dwellings consented and house price growth over the last 10 years.
So what?
Supply and demand’s axiomatic relationship sets the price of products and services. So in looking at what’s likely to happen to prices, what we’re really asking is: What has happened to things affecting demand and supply?
Here’s what we know. First, the demand side, or who is willing and able to buy houses:
• Auckland’s population continues to grow rapidly as net migration remains near record levels.
• The effect of foreign buyers being removed from the existing home market is baked into prices.
• Unemployment remains exceptionally low, and household incomes are rising.
• Interest rates are at record lows, and if anything, are likely to fall further making it possible to service more debt.
• The threat of a capital gains tax is gone indefinitely. This is music to the investor’s ears.
• That said, median house prices of $850,000 remain exceptionally high; saving for the deposit is a significant damper on demand.
And on the housing supply side:
• We haven’t built enough houses relative to our recent growth or our trans-Tasman neighbours.
• The Unitary Plan has stimulated a major boom in new dwellings being consented, so the gap is unlikely to be widening much now, but we do have a shortfall of at least 46,000 dwellings we’re a long way from eliminating.
This balance plus Auckland’s steady economic outlook mean a melt-down in the housing market here without a sharp rise in unemployment and/or interest rates is unlikely. While inside the realm of possibility, these eventualities are outside the realm of probability over the medium term.
Instead, prices are likely to bob around current levels, which is good news for macroprudential stability. Affordability is slowly improving (the best it’s been in five years), which is good news for first home buyers although prices remain high. But those who have bought for capital gains in the last three years will be least happy with the outlook.
*David Norman is chief economist at the Auckland Council. This article was first published here.

We welcome your comments below. If you are not already registered, please register to comment
Remember we welcome robust, respectful and insightful debate. We don't welcome abusive or defamatory comments and will de-register those repeatedly making such comments. Our current comment policy is here.