
Continuing on with updating my regular charts in light of the national accounts revisions released last month, I got to the one distinguishing (indicatively) between real growth in the tradables and non-tradables sectors of the economy. Recall that for these purposes the primary sector (agriculture, forestry, fishing, and mining) and the manufacturing sector count as tradable, together with exports of services. The rest of GDP is classed, loosely, as non-tradables. As I’ve noted in an earlier post
The idea is to split out those sectors which face international competition from those that don’t. It is no more than an indicator, and people often like to point out the components of “non-tradables” where, at least in principle, there is international competition. But as a rough and ready indicator, it serves its purpose. It was first developed by a visiting IMF mission about 15 years ago to help illustrate how one might think about the impact of a lift in the real exchange rate.
Here is the latest version of the chart, with both series expressed in per capita terms.
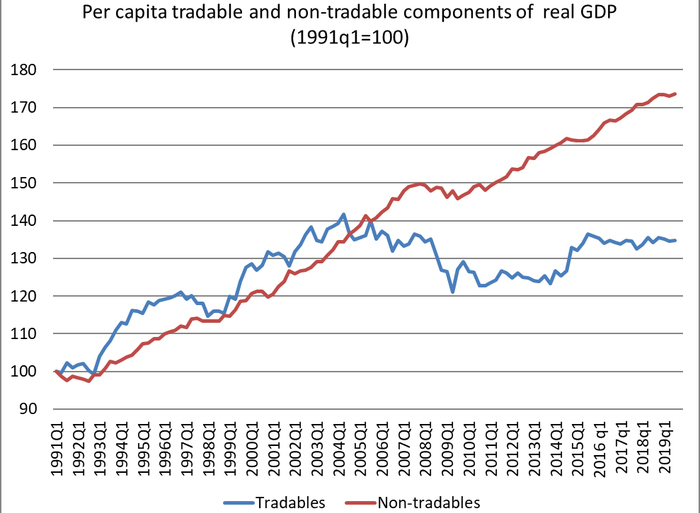
In per capita terms, there has been no growth at all in (this indicator of) the tradables sector since about 2002. That is 17 years now. The economy is increasingly concentrated in the non-tradables sector, the bits (generally) not very exposed to international competition.
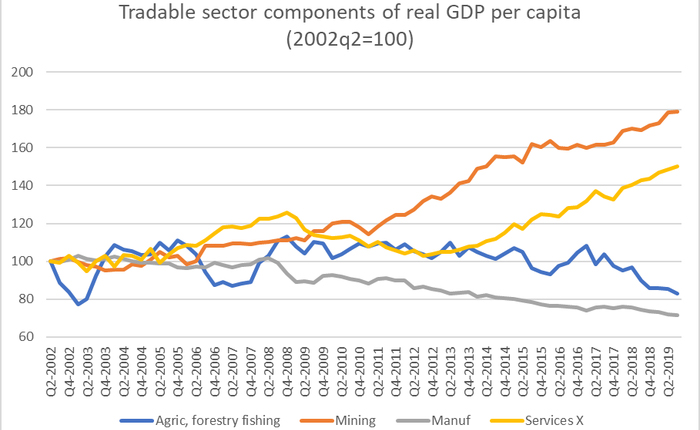
One can – people do – quibble about adding up these components, so here is a chart of the individual components of the tradables sector measure. It starts from mid-2002, when the tradables aggregate first got to around the current level.
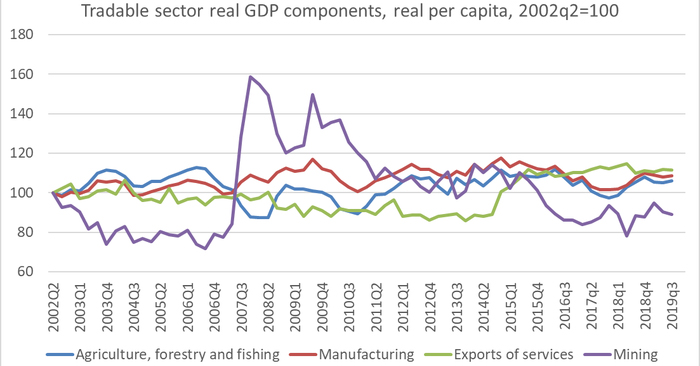
None of these sectors has done particularly well, The best performer – oft-cited hope of the future – services has averaged per capita growth of 0.6 per cent annum. The mining sector is smaller than it was, and agriculture, forestry and fishing (taken together) has managed no per capita growth since 2012.
Perhaps there is no connection at all between this performance and developments in the real exchange rate
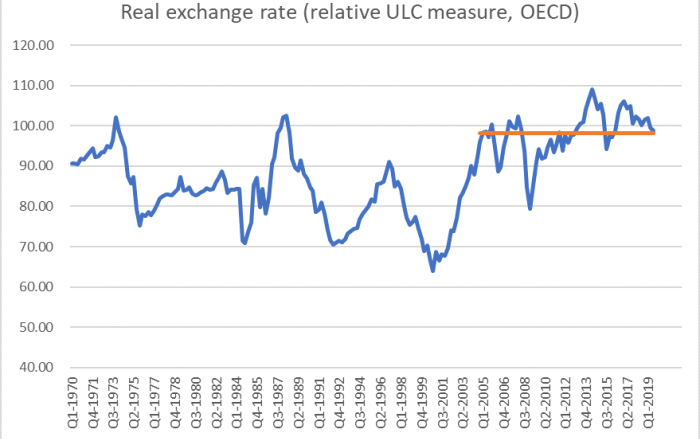
but I doubt many detached observers would think so.
It can get a little repetitive making the point, so this time I decided to put together – for the first time in some years – the comparable charts for Australia.
Here is the aggregate chart for Australia
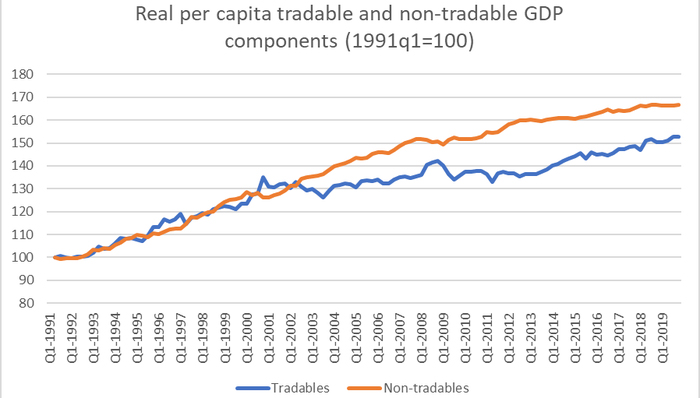
Australia’s tradables sector had also gone more or less sideways for a while, but no longer. Here is how the two countries’ tradables sectors look like on the same chart.
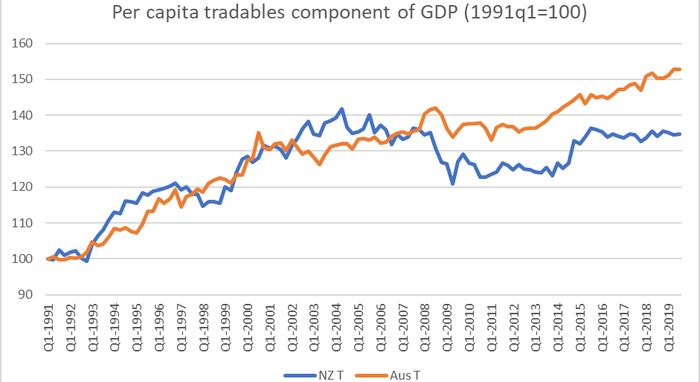
The 1990s were pretty good for the tradables sectors of both countries. And although Australia has again been performing better in the last few years, even that growth is slower than Australia experienced in the 1990s. As for New Zealand….well, no growth at all.
Here, for completeness, are the non-tradables sectors of the two countries.
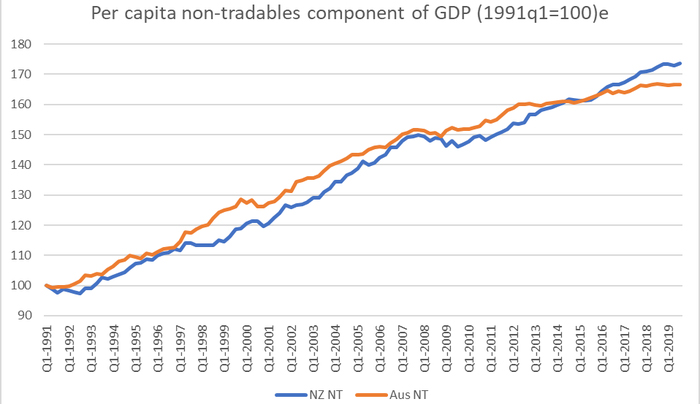
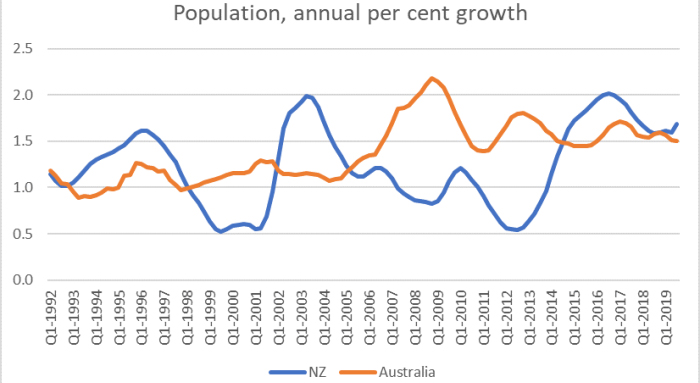
Our non-tradables sector has been growing a bit faster than Australia’s in recent years. That looks to be mostly because we’ve had a period of faster population growth – rapid population growth tends to require more resources devoted to non-tradables sectors (notably construction).
And what about the breakdown of Australia’s tradables sector?
It is very different from the New Zealand picture in almost every respect. The mining line didn’t surprise me – it was the story I expected to be telling – but the others did, including the continued strong growth of services exports. Back in 2014 and 2015 it looked as though something similar was happening on both sides of the Tasman, but no longer: services exports here (per capita) have simply stagnated again.
New Zealand and Australia have both enjoyed pretty strong terms of trade in the last couple of decades (Australia’s more volatile than ours). But over the decades, New Zealand average productivity (real GDP per hour worked) has kept dropping further behind Australia’s – roughly 42 per cent ahead of us now, compared to about 25 per cent in 1970. And yet OECD data suggest our real exchange rate has risen relative to Australia’s over that half-century.
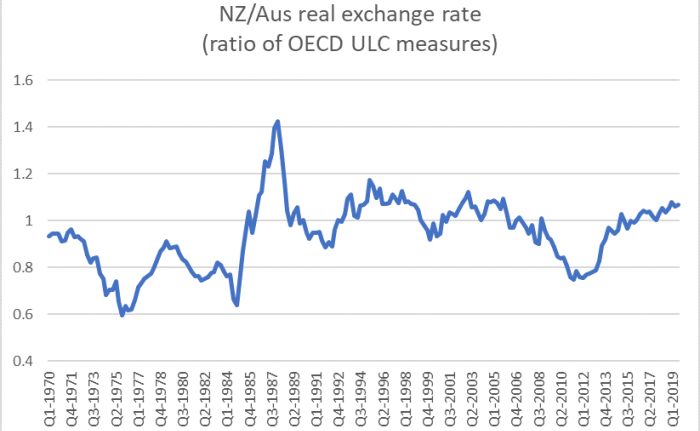
It isn’t that much of a rise – around 15 per cent – but the longer-term economic fundamentals pointed in the direction of a fall at least that large.
Policymakers here have, unwittingly (although that isn’t much of an excuse after all this time) delivered a climate – a combination of factors – that mean it is very difficult for the tradables sector to grow much in New Zealand.
Unless that changes it is difficult to envisage New Zealand not continuing to slip further behind, not just Australia but other advanced countries as well.
If the government were at all serious about responding to the productivity failings, these are sorts of imbalances they’d be instructing the Productivity Commission to investigate and make sense of.
* Michael Reddell is a Wellington-based independent economist and commentator on economic and financial affairs, blogging at www.croakingcassandra.com. He previously worked at the Reserve Bank where he had held various economics and management positions over many years, including Head of Financial Markets and manager responsible for economic forecasting. This article was first published on Croaking Cassandra and is used here with permission.
13 Comments
Comparing the two graphs for breakdown of tradeables is interesting. No problem understanding why mining is doing well in Australia but why are their exportable services growing and while ours are stagnant? Presumably this means tourism and international students - what we doing wrong or they are doing right?
Thanks. Great article
Yes. Kudos to Reddell and Interest.co.nz for presenting analysis and of the macro data releases with a focus on productivity growth.
NZ economy has edged into RE mindsets the past 15 years, the academic, think tank, creativity, productivity ranking are retrieving progressively then we've also imported Asians mindset, get into property ladder as you won't believe that they actually can't get it to themselves back home then education, once done? migrate to countries that will pay more than NZ...then it cycle back to that consumption & importing goods mantra.
Hi Michael, Excellent article. Is it possible to know what percentage of Non Tradeable is housing market.
Hurray for Michael Reddell. What a breath of fresh air.
‘Better than ever’ may not be good enough
The worldwide economy was supposed to have accelerated into full blooming recovery, but it didn’t and more so it didn’t whilst the dollar system was embroiled in very obvious malfunctions somehow no one saw coming. Link
Ridding ourselves of LIBOR will not help.
What’s the big deal with LIBOR? It’s actually two big deals, both of them truly important elements in understanding our great predicament.
The first is with LIBOR itself, the main complaint. Scandal. Bank manipulations. At least that’s what they say.
Their real beef with this short-term rate index is something altogether different, about what it represents. Offshore money.
That’s what eurodollars are, after all, and LIBOR is the eurodollar rate. As I wrote last year, it is a constant reminder that all is not as it seems in the monetary realm. It’s an enormous and dizzyingly complex zoo spread out over all sorts of boundaries not just geography.
This gets right to the heart of the matter. Is the Federal Reserve responsible for only banks operating in the United States? Or, does the central bank owe responsibility to the currency? The dollar works well enough here domestically, but it’s the eurodollar that keeps pulling the world into repeated trouble. Link
Interesting article. I worked in the tradeable sector during the Alan Bollard years and witnessed the huge damage his policy settings inflicted upon NZ exporters first hand. If poor government policies at the time (over stimulatory spending) weren't bad enough then having a virtually untouchable economic dictator capriciously undermining the efforts of an entire sector of the economy by driving the exchange rate sky high with his ludicris interest rate settings was even worse and ultimately hugely damaging to the economu. In my opinion you can track the long term drop off in the tradeables to that era and apportion blame entirely at the feet of the former RB governer. Given the stable returns to be made in local services and real estate, particularly, who would ever go back into tradeables, you'd be mad to given the nature of our overly open and unpredictable external economy. Consequently that sector remains mostly flat lined and until a plan to rebuild the value added manufacturing sector onshore materialises (highly unlikely due to lack of cohesive government policy in the past 20 years) it will stay that way.
That high exchange rate was a key driver in the standard of living not collapsing under us. Here we are with oil half what it has been in historic highs and petrol is more expensive than ever. God help NZ if oil ever makes it back to $148 USD a barrel.
The difference in productivity is staggering and should be keeping our policymakers awake at night. I seem to recall that John Key promised to close that gap!
I find it really difficult to understand why the exchange rate is so high given this fact. Can anyone explain that to me?
Excellent analysis. New Zealand has been importing people and money for its own little merry-go-round. The contraption is laden with debt (much, in truth, unpayable), but adding more people and additional borrowing has kept it turning. The GDP and asset-inflation music at it revolves drowns out any concern with increasing international earnings or increasing productivity per capita. Now and again a politician goes past waving and smiling, and - look - just then - showing empathy. Underneath the machine, however, our national infrastructure is just about gummed up. How many more passengers and creditors can the merry-go-round carry?
Good article Michael. The lack of comments must surely indicate readers are supportive and in agreement with you. If only our policy makers would not only support and agree with your position but do something. Keep up the good work.
Excellent article. MR has been pounding the Productivity Drum for many a moon now, with little to no apparent success in terms of policy. The headwinds are all too obvious:
- A short electoral term means changes may accrue to the benefit of the Next Lot, not this one, so next to no incentive there
- Immigation, which is primarily to urban destinations, skews the electoral weighting still further to the (generalising wildly) know-nothing urbanites who are clueless about wealth creation except for Hooses
- Ideological positions on many avenues which act to block improvements: gene editing, pest control, oil/gas, mining - it's a long and sorry list
.Expect more of the same - policy stasis if not further outright restriction, and continued slow decline. It's not what any of us Voted for, but the sad truth is that the trajectory isn't electorally determined any more. It's baked in the cake, as the saying has it. All else is distraction.
We welcome your comments below. If you are not already registered, please register to comment
Remember we welcome robust, respectful and insightful debate. We don't welcome abusive or defamatory comments and will de-register those repeatedly making such comments. Our current comment policy is here.