

Seen this Economist chart recently?
It has been reproduced everywhere, after RadioNZ first highlighted it.
Scary stuff.
How do Kiwis afford to buy houses like this? Last year we bought 90,462 of them from other owners and an unknown number of new-builds (probably about 27,000). All up that is 117,500 transactions.
These 2016 numbers are +2,000 more than for 2015.
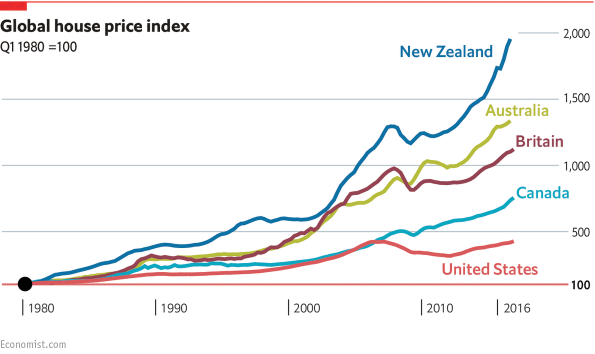
So, we are doing more transactions even though there are sharply higher prices year-on-year.
But houses are rarely paid for in cash. They are almost always bought with mortgages. In fact, between 2015 and 2016 RBNZ data shows there were +40,500 additional mortgages over the year, a +2.7% rise. (Just in case you thought it was all those naughty cashed-up foreigners who are driving our markets with their cash-only deals. Apparently those are just random anecdotes and not market-moving trends.)
When you benchmark the actual experience against mortgage payments and rents, the story is nowhere near as scary.
We did that a few days ago and it is worth repeating here. We don't have data all the way back to 1980 to match the Economist chart; our review started in 2007, and looked at changes over the past decade.
Here are the national perspectives again, updated with some main centre detail.
The lines in these charts are indexed to a common point of January 1, 2007 which shows the relative change since then. The values at the starting point are not the same; it is only the index point. That explains why the values displayed will always have the mortgage payment or the rent less than the household take-home pay, even if one has changed faster than the other. The lines reveal the rate of change.
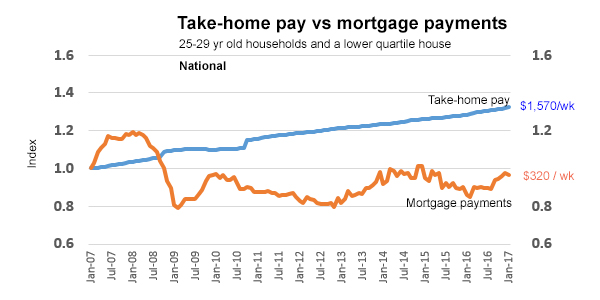
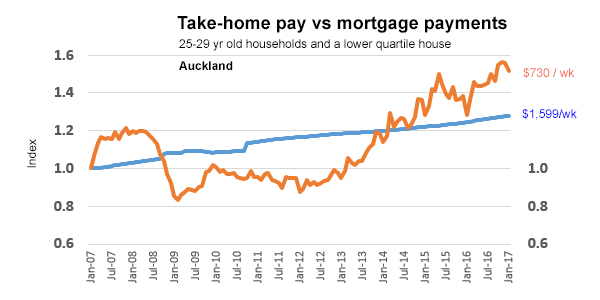
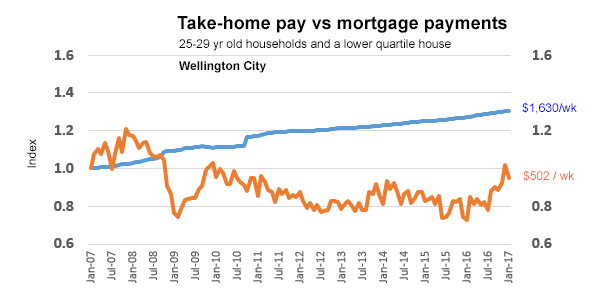
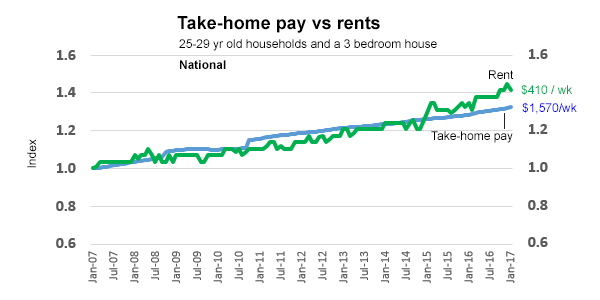
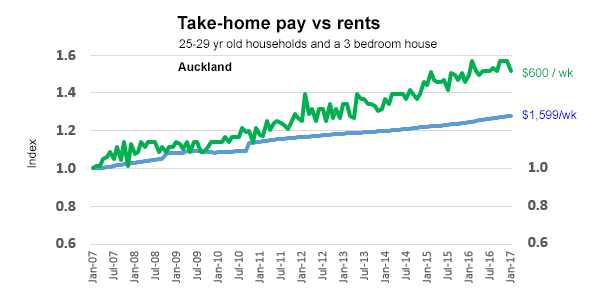
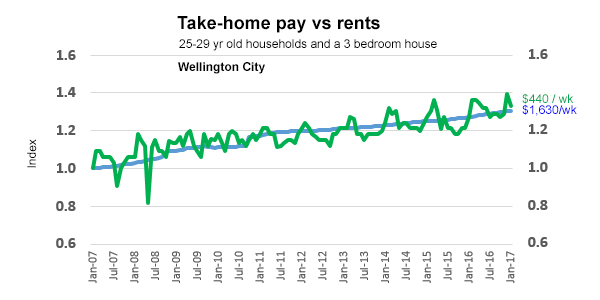
The lines in these charts show the relative changes over the decade from January 2007, and not the absolute values. The ending values are noted to the right of each line.
The bottom line? New Zealand has a recent affordability issue, but it is relatively minor when related to take-home pay.
Lower house prices would help affordability everywhere, but household budgets need to deal with rent or the mortgage payments, rather than the face value of house prices.
The real issues are in Auckland, and that is distorting national averages. In most other urban areas, home loans are affordable for those households on median incomes.
We will add Christchurch charts later.
We welcome your comments below. If you are not already registered, please register to comment
Remember we welcome robust, respectful and insightful debate. We don't welcome abusive or defamatory comments and will de-register those repeatedly making such comments. Our current comment policy is here.