

New Zealand households have a huge portfolio of assets on their balance sheets - far more than most of us realise.
Most conversation around the household balance sheet revolves around liabilities, and mainly those for housing.
But you are likely to be surprised by the scale of the assets.
No-one is suggesting this wealth is evenly distributed, but conversation about wealth distribution should start by understanding this data.
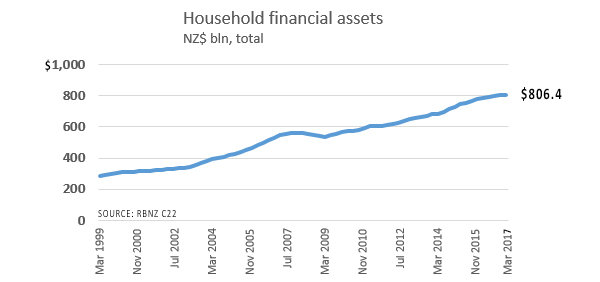
Household assets are growing modestly - over the past ten years they have grown on average +4.0% pa. This is entirely credible because if you remove inflation, that basically mirrors GDP growth over the period.
But the key thing is, apart from the Global Financial Crisis, that growth has been steady and compounding.
Over the past 10 years, these assets have risen from $545 billion to $806 billion, almost a 50% rise.
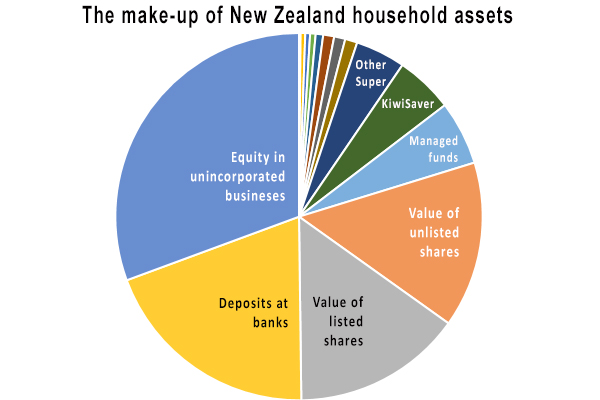
These are the components of these assets, according to the excellent analysis by the Reserve Bank. It is very comprehensive and is missing just one element that we can think of; what households have invested into mortgage trusts and property syndicates. (And we also don't know how much is 'loaned' by loan sharks and held as loans in the black economy).
| NZ$ bln, as at March, | Note | 2007 | 2012 | 2017 | avg pa growth |
| only as held by households ... | $ | $ | $ | % | |
| Notes & Coin | C22 | 1.9 | 2.5 | 3.3 | +5.8 |
| Deposits at banks | S40 | 67.9 | 101.9 | 157.8 | +8.8 |
| Deposits at non-bank deposit takers | T4 | 12.1 | 4.9 | 3.4 | -11.8 |
| Kiwibonds, other Govt bonds | D30 | 0.6 | 0.7 | 0.5 | -1.7 |
| Local Govt securities | C22 | 0.3 | 0.4 | 0.3 | +2.4 |
| Corporate bonds | C22 | 2.9 | 4.4 | 3.9 | +3.1 |
| Loans via lawyers/contributory mortgages | C22 | 0.8 | 0.5 | 0.3 | -9.8 |
| NZ listed shares | C22 | 109.3 | 76.3 | 120.4 | +1.0 |
| Unlisted shares | C22 | 59.3 | 91.6 | 117.9 | +7.1 |
| Equity in unincorporated businesses | C22 | 196.8 | 228.0 | 246.9 | +2.3 |
| Overseas listed shares | C22 | 7.8 | 6.3 | 7.8 | +0.1 |
| Managed Funds | C22 | 42.2 | 37.6 | 45.4 | +0.7 |
| Cash management trusts | T46 | 7.9 | |||
| Mortgage trusts/property syndicates | ?? | ?? | ?? | ||
| Equity in life insurance policies | T42 | 10.5 | 8.1 | 8.7 | -0.2 |
| KiwiSaver | T43 | 12.5 | 41.0 | ||
| GSF / NPF / other Superannuation | T44 | 31.9 | 31.7 | 35.4 | +1.0 |
| Non-life insurance claims | C22 | 0.8 | 9.9 | 5.3 | +20.8 |
| Peer-to-peer | 0.1 | ||||
| Loan shark / black economy assets | ?? | ?? | ?? | ||
|
|
===== | ===== | ===== | ----- | |
| Total household financial assets | C21 | $ 545.0 | $ 617.3 | $ 806.4 | +4.0 |
The overall growth may be just +4.0% pa, but that masks some other significant changes which are shown above. Specifically, bank deposits are up +8.8% pa, and the collapse of the finance company industry can also be seen in the above table.
Also the growth in equity in the businesses of sole traders and other unincorporated enterprises has been very sub-par.
However that low growth hasn't shaken the dominance of these sorts of enterprises - it's just that they are not really growing. And neither are the holdings of households in listed shares.
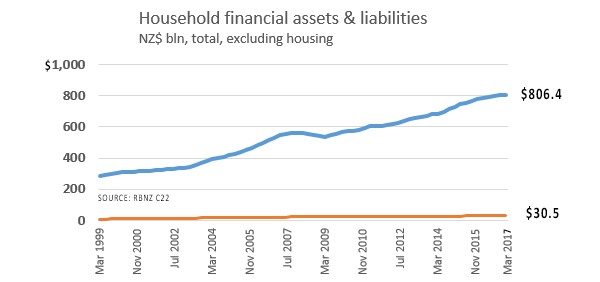
This huge asset base is not being propped up by debt. Leaving housing debt to one side for the moment (because housing assets are not included in this analysis either), this $806.4 bln of household assets comes with just $30.5 bln of financial liabilities.
That $30.5 bln of liabilities are made up of $15.3 bln in consumer debt (of which $6.8 bln is for credit cards), plus $15.2 bln in student loans. (And consistent with having no coverage on the asset side, we just don't know the level of what is owed in the black economy, including to loan sharks.)
If you have read this far, you are likely to be wanting to know what the assets and liabilities are for households related to housing.
Here is that data: (the blue line is the asset value, the orange line is the liabilities owed by households to both banks, and to other housing lenders).
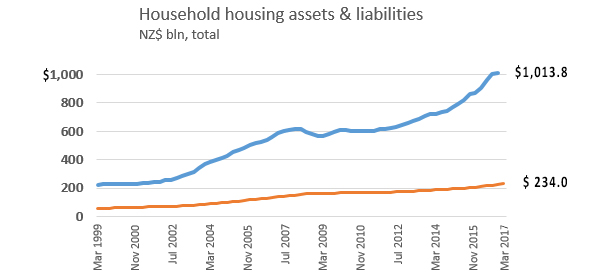
Adding the two components (housing and non housing assets), total household assets in New Zealand are an amazing $1.8 trillion. Who knew? Household liabilities total $264.5 bln or only 15% of the asset values.
That is the size of the pie. Now we are ready to talk about the distribution of this wealth.
We welcome your comments below. If you are not already registered, please register to comment
Remember we welcome robust, respectful and insightful debate. We don't welcome abusive or defamatory comments and will de-register those repeatedly making such comments. Our current comment policy is here.