

p>We are ending the year with fixed mortgage rates rising. Today, wholesale swap rates took yet another jump.
So it is a good time to review what happened in 2016 with mortgage rates.
One big question for many borrowers is whether it is wise to stay with a main bank. Are they competitive?
It is a question that is more relevant these days as banks move to protect and raise margins and seem to be moving away from building market share.
It is an especially relevant question for borrowers with our largest mortgage bank, ANZ. They seem to end the year with the highest carded rates and have had that position for some time. When fixed mortgages are a commodity, ,why do so many borrowers pay top market interest rates for their home loan?
Is the 'premium' they pay a main bank immaterial, or worth it in some other way? Apparently it is, because ANZ was the only main bank to increase its mortgage lending exposure relative to all its other lending.
Most New Zealand banks qualify for the label 'mortgage banks' - the exception being the BNZ. Most bank loans are mortgages, reflecting the dominance of residential property in the New Zealand economy. Here is the latest RBNZ data:
| Proportion of mortgage lending of all lending | Mortgage | Market | ||
| as at June | 2015 | 2016 | Lending | Share |
| Main banks | % | % | $ bln | % |
| - ANZ | 53.0 | 55.4 | 63.009 | 29.6 |
| - ASB | 66.8 | 66.0 | 47.791 | 22.4 |
| - BNZ | 46.6 | 46.2 | 33.917 | 15.9 |
| - Kiwibank | 93.4 | 92.3 | 15.454 | 7.3 |
| - Westpac | 60.1 | 59.7 | 44.336 | 20.8 |
| Weighted average all main banks | 57.9 | 58.2 | 96.0 | |
| Second tier banks | ||||
| - Co-operative Bank | 92.0 | 92.7 | 1.742 | 0.8 |
| - HSBC | 29.5 | 36.4 | 1.258 | 0.6 |
| - SBS Bank | 76.6 | 76.8 | 2.288 | 1.1 |
| - TSB Bank | 81.8 | 80.9 | 3.217 | 1.5 |
| Weighted average these 2nd tier banks | 65.1 | 69.2 | 4.0 | |
| Source: RBNZ G1 | ||||
Looking at the popular 2 year fixed rates as a way to assess how things have changed, the main banks ended 2016 with rates higher than when they started, at 4.50% compared with 4.44% at the start.
The challenger banks however became more rate competitive, ending almost exactly where they started and -6 bps lower on average than the main banks.
But these averages mask some fairly substantial variations.
The key feature was the two sub-4% offers from HSBC during 2016. We also had a brief 3.99% offer from Kiwibank in May.
ANZ had carded rates an average of +26 bps more than the 'best rate' over the year. ASB had +22 bps higher carded rates on the same basis. For BNZ it was the same +22 bps premium. For Kiwibank it was +16 bps, and for Westpac it was a +20 bps premium.
Second-tier banks have very low market shares, and low rate offers seems to move the market very little. (Having said that, it should also be noted that the challenger banks do not have the capital capacilty to handle any significant market share shift their way.)
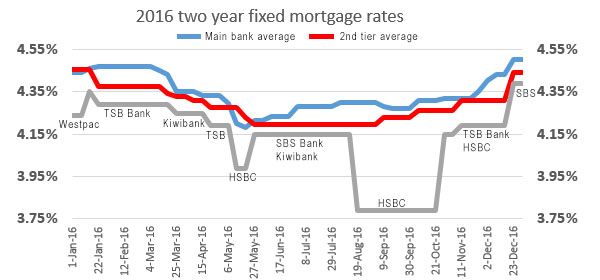
In terms of overall price competitiveness, here is how these banks positioned themselves on average over all of 2016, and at the end of the year.
| relative price competitiveness | 2016 average | year-end | |
| two year fixed only | rate % | premium % | |
| #9 | ANZ | 4.39 | +0.20 |
| #8 | Co-operative Bank | 4.38 | +0.16 |
| #7 | ASB | 4.35 | +0.10 |
| #6 | BNZ | 4.35 | +0.20 |
| #5 | Westpac | 4.33 | +0.06 |
| #4 | Kiwibank | 4.30 | lowest= |
| #3 | SBS Bank | 4.25 | lowest= |
| #2 | TSB Bank | 4.24 | +0.10 |
| #1 | HSBC Premier | 4.21 | lowest= |
A mortgage may be a 'commodity' these days but price (as represented by carded rates) doesn't seem to change the borrower's choice of bank.
We don't move for a 0.25% benefit.
We welcome your comments below. If you are not already registered, please register to comment
Remember we welcome robust, respectful and insightful debate. We don't welcome abusive or defamatory comments and will de-register those repeatedly making such comments. Our current comment policy is here.