
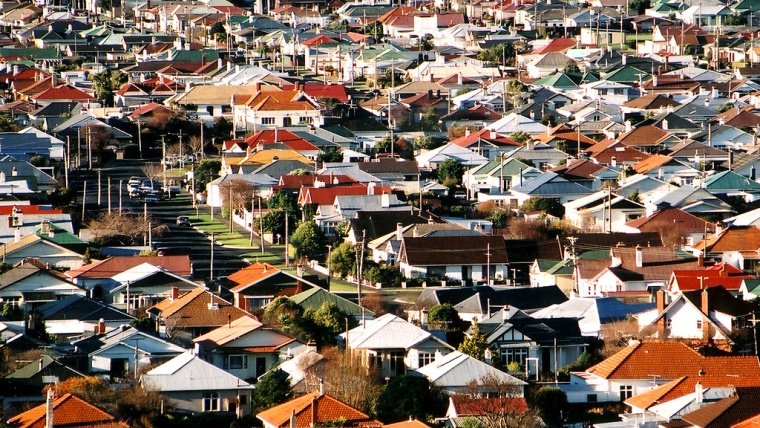
QV is reporting that their national house price index rose +4.0% in December from a year ago and that more than half of that came in the past three months.
For Auckland, there was zero annual rise, but this market did make back +1.9% in the past three months.
This data reveals that house prices are starting to rise quickly again, and the effect is nationwide.
The fastest year-on-year growth happened in Dunedin, with QV's price benchmark up +18.3%, with some parts of the southern city having risen more than +10% in the past three months alone.
Christchurch price rises are much more subdued, up +2.3% in a year, but almost all of that (+2.1%) came in the past three months.
The Wellington urban region saw average annual increases of +5.3% annually and more than half of that was also in the past 90 days. In the Wairarapa, annual increases are approaching +10%.
The twin cities Napier and Hastings (with a population now greater than Dunedin, so should also now be considered a 'main centre') recorded annual rises of +9.9% and +13.0% respectively, although their rise has been more even over the past twelve months, starting earlier than in most other centres.
Tauranga recorded an annual gain of +5.9%, also more evenly distributed in the year.
Hamilton's rise was +5.8%, half in the past three months.
While existing homeowners are getting a positive wealth effect, these sharp moves higher nationwide will bring Auckland's famous housing affordability problems to become a broader stress elsewhere. Prospective first home buyers may feel their opportunities slipping away. Low interest rates are no solution - they have been low all year, so rising prices now only mean purchase deposits have become a larger mountain to climb. And there seems to be little prospect that interest rates will fall further.
In fact, low interest rates are the problem. They allow those who do have a market deposit to bid up prices.
The other problem is that there is a kind of sellers strike in place - there are record-low numbers of houses for sale, especially away from Auckland. That lack of supply means only the well-healed can win competitions for the few dwellings on the market.
QV's General Manager David Nagel describes the situation as a market "thriving" and being "a welcome boost". He sees "multiple buyers looking to purchase a limited number of properties" and "existing property owners looking to restructure their financial position to enable the purchase of an additional property". With industry reports and attitudes like that, set against the interests of aspiring first home buyers, we seem to be headed toward a new and more widespread housing stress period.
Perhaps we needed KiwiBuild and RMA reform to have cleared away the regulatory and land price hurdles by now so that the impending new housing affordability crisis was averted. Sadly, no housing reform actions have succeeded. And that will no doubt mean Election 2020 will be again set against continuing housing policy failures.
| QV House Price Index | ||
| December 2019 | ||
| Territorial authority | Average* current value | 12 month change% |
| Auckland Area | 1,047,110 | -0.1% |
| Wellington Area | 746,955 | 8.6% |
| Main Urban Areas | 814,597 | 3.0% |
| Total NZ | 710,129 | 4.0% |
| Far North | 479,070 | 11.6% |
| Whangarei | 548,568 | -2.6% |
| Kaipara | 565,911 | 2.8% |
| Auckland - Rodney | 943,938 | -0.7% |
| Rodney - Hibiscus Coast | 920,876 | -0.9% |
| Rodney - North | 967,221 | -0.7% |
| Auckland - North Shore | 1,201,420 | -0.9% |
| North Shore - Coastal | 1,377,120 | -0.5% |
| North Shore - Onewa | 969,594 | 0.0% |
| North Shore - North Harbour | 1,151,166 | -3.6% |
| Auckland - Waitakere | 820,896 | -0.2% |
| Auckland - City | 1,244,959 | 0.9% |
| Auckland City - Central | 1,088,499 | 0.5% |
| Auckland_City - East | 1,565,061 | 1.1% |
| Auckland City - South | 1,110,808 | 1.4% |
| Auckland City - Islands | 1,151,244 | -1.3% |
| Auckland - Manukau | 901,918 | -0.5% |
| Manukau - East | 1,153,274 | -0.3% |
| Manukau - Central | 699,877 | -1.1% |
| Manukau - North West | 784,966 | 0.0% |
| Auckland - Papakura | 716,121 | 2.1% |
| Auckland - Franklin | 677,234 | 0.5% |
| Thames Coromandel | 778,319 | 4.8% |
| Hauraki | 440,151 | 5.5% |
| Waikato | 512,897 | 5.3% |
| Matamata Piako | 493,740 | 7.5% |
| Hamilton | 604,034 | 5.8% |
| Hamilton - North East | 748,229 | 4.9% |
| Hamilton - Central & North West | 559,843 | 6.0% |
| Hamilton - South East | 560,153 | 6.7% |
| Hamilton - South West | 538,774 | 5.6% |
| Waipa | 607,861 | 7.9% |
| Otorohanga | 381,820 | 29.4% |
| South Waikato | 268,750 | 7.0% |
| Waitomo | 239,545 | 7.7% |
| Taupo | 537,788 | 9.3% |
| Western BOP | 682,276 | 4.3% |
| Tauranga | 763,422 | 5.9% |
| Rotorua | 499,702 | 13.1% |
| Whakatane | 499,609 | 9.0% |
| Kawerau | 288,259 | 17.6% |
| Gisborne | 394,380 | 21.5% |
| Hastings | 563,890 | 13.0% |
| Napier | 578,861 | 9.9% |
| Central Hawkes Bay | 390,594 | 8.8% |
| New Plymouth | 495,649 | 8.3% |
| Stratford | 317,605 | 15.3% |
| South Taranaki | 265,187 | 13.2% |
| Ruapehu | 251,778 | 21.7% |
| Whanganui | 333,368 | 20.5% |
| Rangitikei | 275,514 | 24.4% |
| Manawatu | 442,466 | 19.6% |
| Palmerston North | 483,695 | 13.7% |
| Tararua | 257,993 | 16.7% |
| Horowhenua | 407,373 | 20.6% |
| Kapiti Coast | 630,426 | 9.3% |
| Porirua | 652,213 | 10.3% |
| Upper Hutt | 603,112 | 14.5% |
| Hutt | 640,173 | 14.5% |
| Wellington | 856,272 | 5.3% |
| Wellington - Central & South | 856,653 | 6.3% |
| Wellington - East | 907,845 | 4.4% |
| Wellington - North | 779,974 | 4.7% |
| Wellington - West | 978,488 | 5.9% |
| Masterton | 400,922 | 7.3% |
| Carterton | 452,319 | 8.3% |
| South Wairarapa | 547,831 | 9.0% |
| Tasman | 615,286 | 4.4% |
| Nelson | 638,842 | 6.2% |
| Marlborough | 496,590 | 5.4% |
| Buller | 206,964 | 8.8% |
| Grey | 229,439 | 8.9% |
| Westland | 259,850 | 5.6% |
| Hurunui | 400,352 | 3.9% |
| Waimakariri | 456,265 | 1.8% |
| Christchurch | 507,852 | 2.3% |
| Christchurch - East | 385,330 | 2.6% |
| Christchurch - Hills | 693,919 | 3.3% |
| Christchurch - Central & North | 596,488 | 2.5% |
| Christchurch - Southwest | 479,893 | 1.0% |
| Christchurch - Banks Peninsula | 548,145 | 4.5% |
| Selwyn | 558,645 | 0.6% |
| Ashburton | 363,928 | 1.7% |
| Timaru | 377,006 | 3.3% |
| MacKenzie | N/A | N/A |
| Waimate | 277,363 | 14.6% |
| Waitaki | 345,982 | 12.2% |
| Central Otago | 559,738 | 10.5% |
| Queenstown Lakes | 1,202,625 | 0.8% |
| Dunedin | 514,680 | 18.3% |
| Dunedin - Central & North | 533,398 | 18.1% |
| Dunedin - Peninsular & Coastal | 480,325 | 19.3% |
| Dunedin - South | 489,031 | 17.9% |
| Dunedin - Taieri | 530,887 | 18.1% |
| Clutha | 261,556 | 21.8% |
| Southland | 344,778 | 19.0% |
| Gore | 259,741 | 11.1% |
| Invercargill | 334,353 | 16.8% |
*The average value of all developed residential properties in the area.
No chart with that title exists.
We welcome your comments below. If you are not already registered, please register to comment
Remember we welcome robust, respectful and insightful debate. We don't welcome abusive or defamatory comments and will de-register those repeatedly making such comments. Our current comment policy is here.