
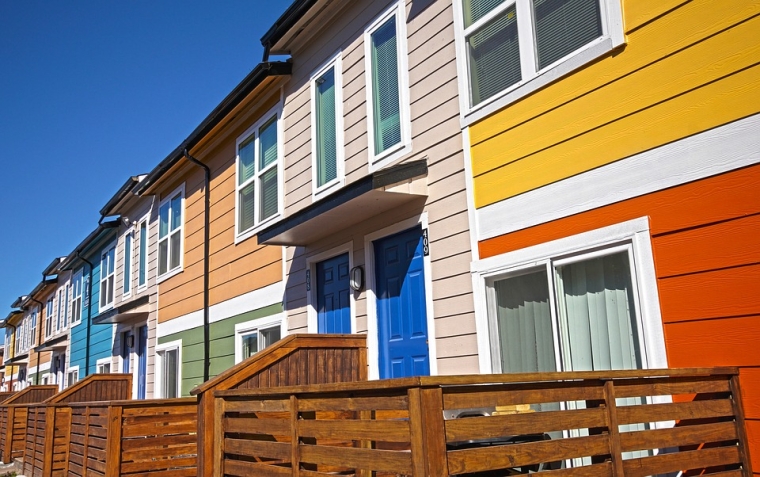
There was a substantial increase in the number of homes being listed for sale in October, with many potential vendors deciding the time is right to sell.
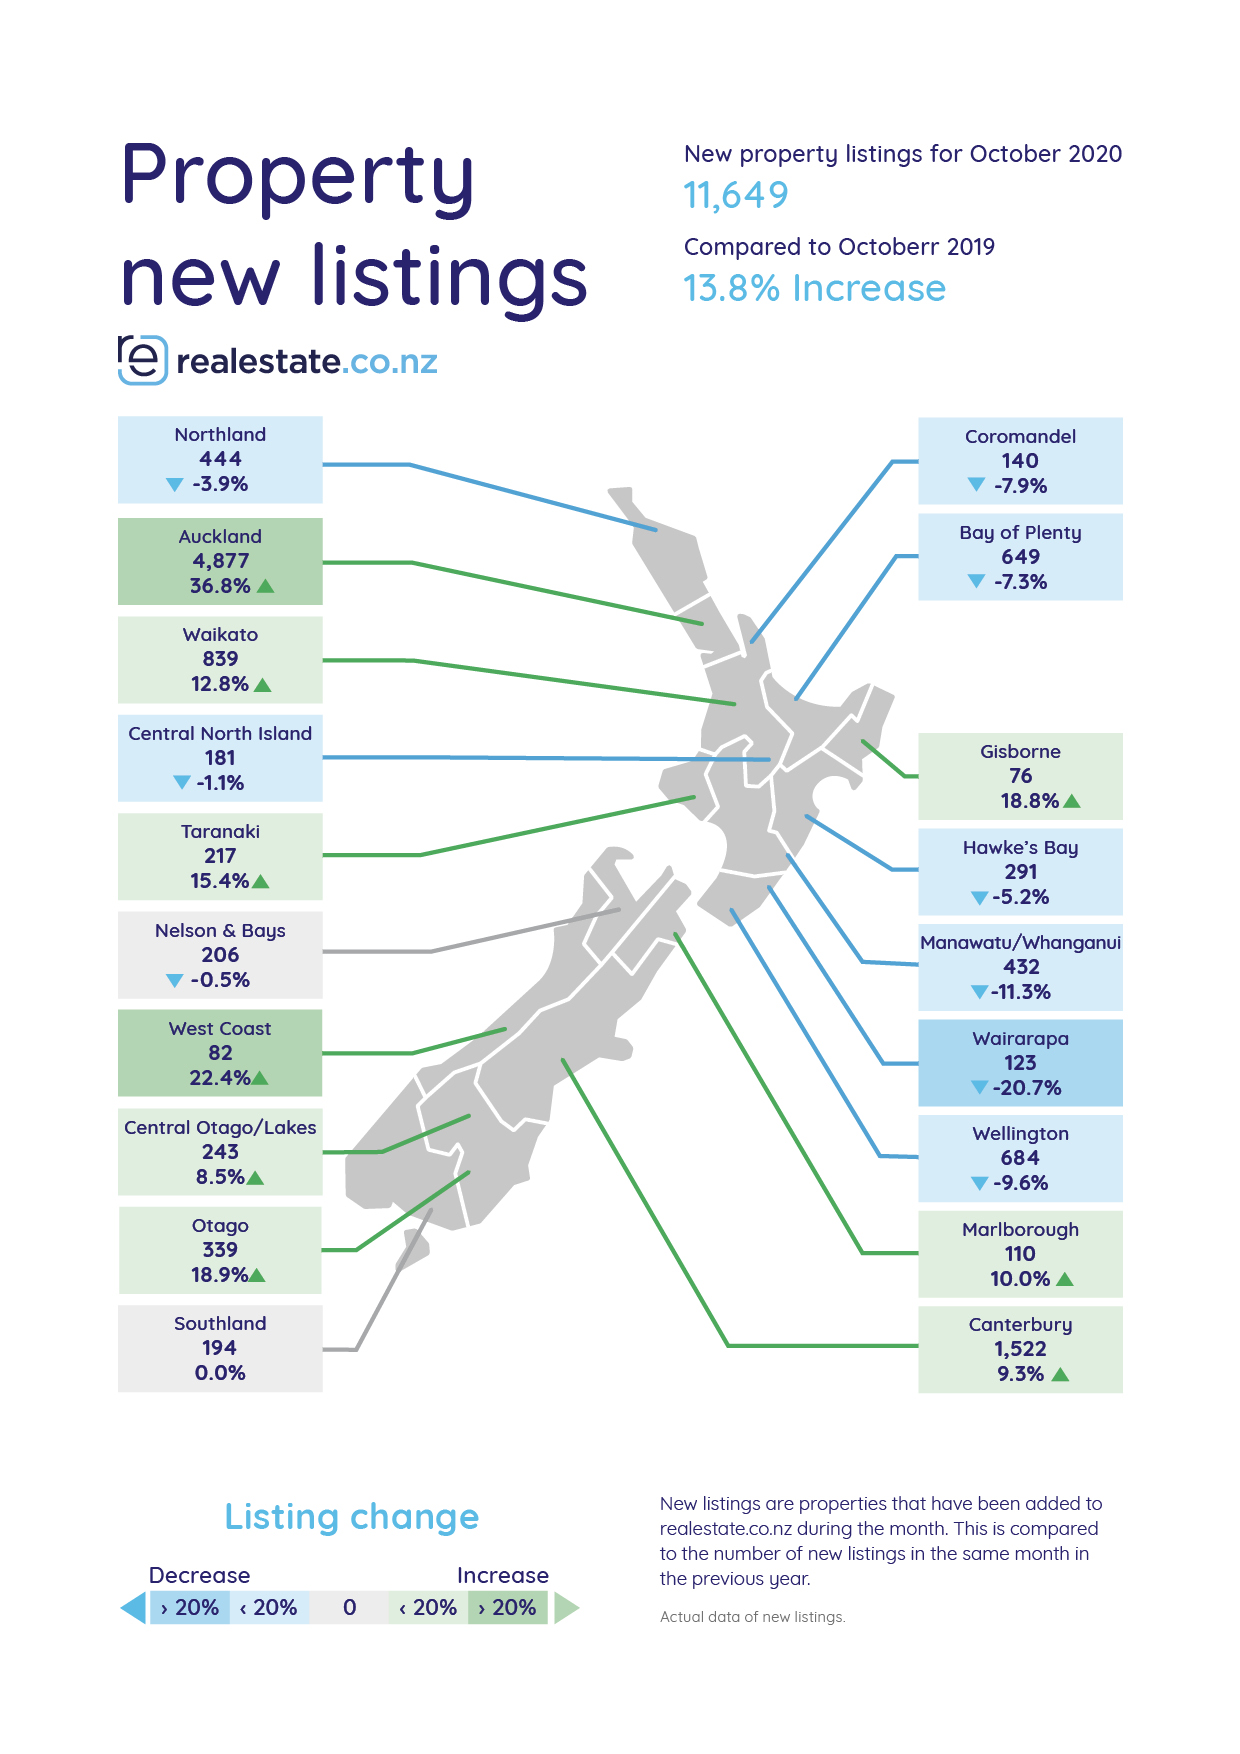
Property website Realestate.co.nz received 11,649 new residential listings in October, up 13.8% compared to October.
The Auckland market was particularly strong, with 4877 Auckland properties being newly listed on the website in October which was up a whopping 36.8% compared to October last year.
That was the highest number of Auckland properties newly listed for sale on the website in any month of the year for more than 12 years.
Other regions where new listings were up strongly compared to October last year were Waikato +12.8%, Taranaki +15.4%, Gisborne +18.8%, Marlborough +10.0%, Canterbury +9.3%, West Coast +22.4%, Otago +18.9% and Central Otago/Lakes +8.5%.
However, new listings in several regions were down compared to a year ago including Wellington -9.6%, Wairarapa -20.7% and Manawatu/Whanganui -11.3% (see chart below).
Realestate.co.nz spokesperson Vanessa Taylor said buyers would be buoyed by the fact they had more properties to choose from than they did at this time last year, and if the increase in new listings continued, this could affect prices in some regions.
"Typically, we see an increase in Kiwis looking to sell during the summer months with a drop off over the Christmas season," Taylor said.
"However, the impact of the nationwide lockdown earlier this year and the changes that many Kiwis are experiencing as a result of COVID-19 mean it's anyone's guess when new listings will peak this season," she said.
Vendors are obviously being encouraged to sell by the buoyant state of the market and that is being reflected in strong average asking prices.
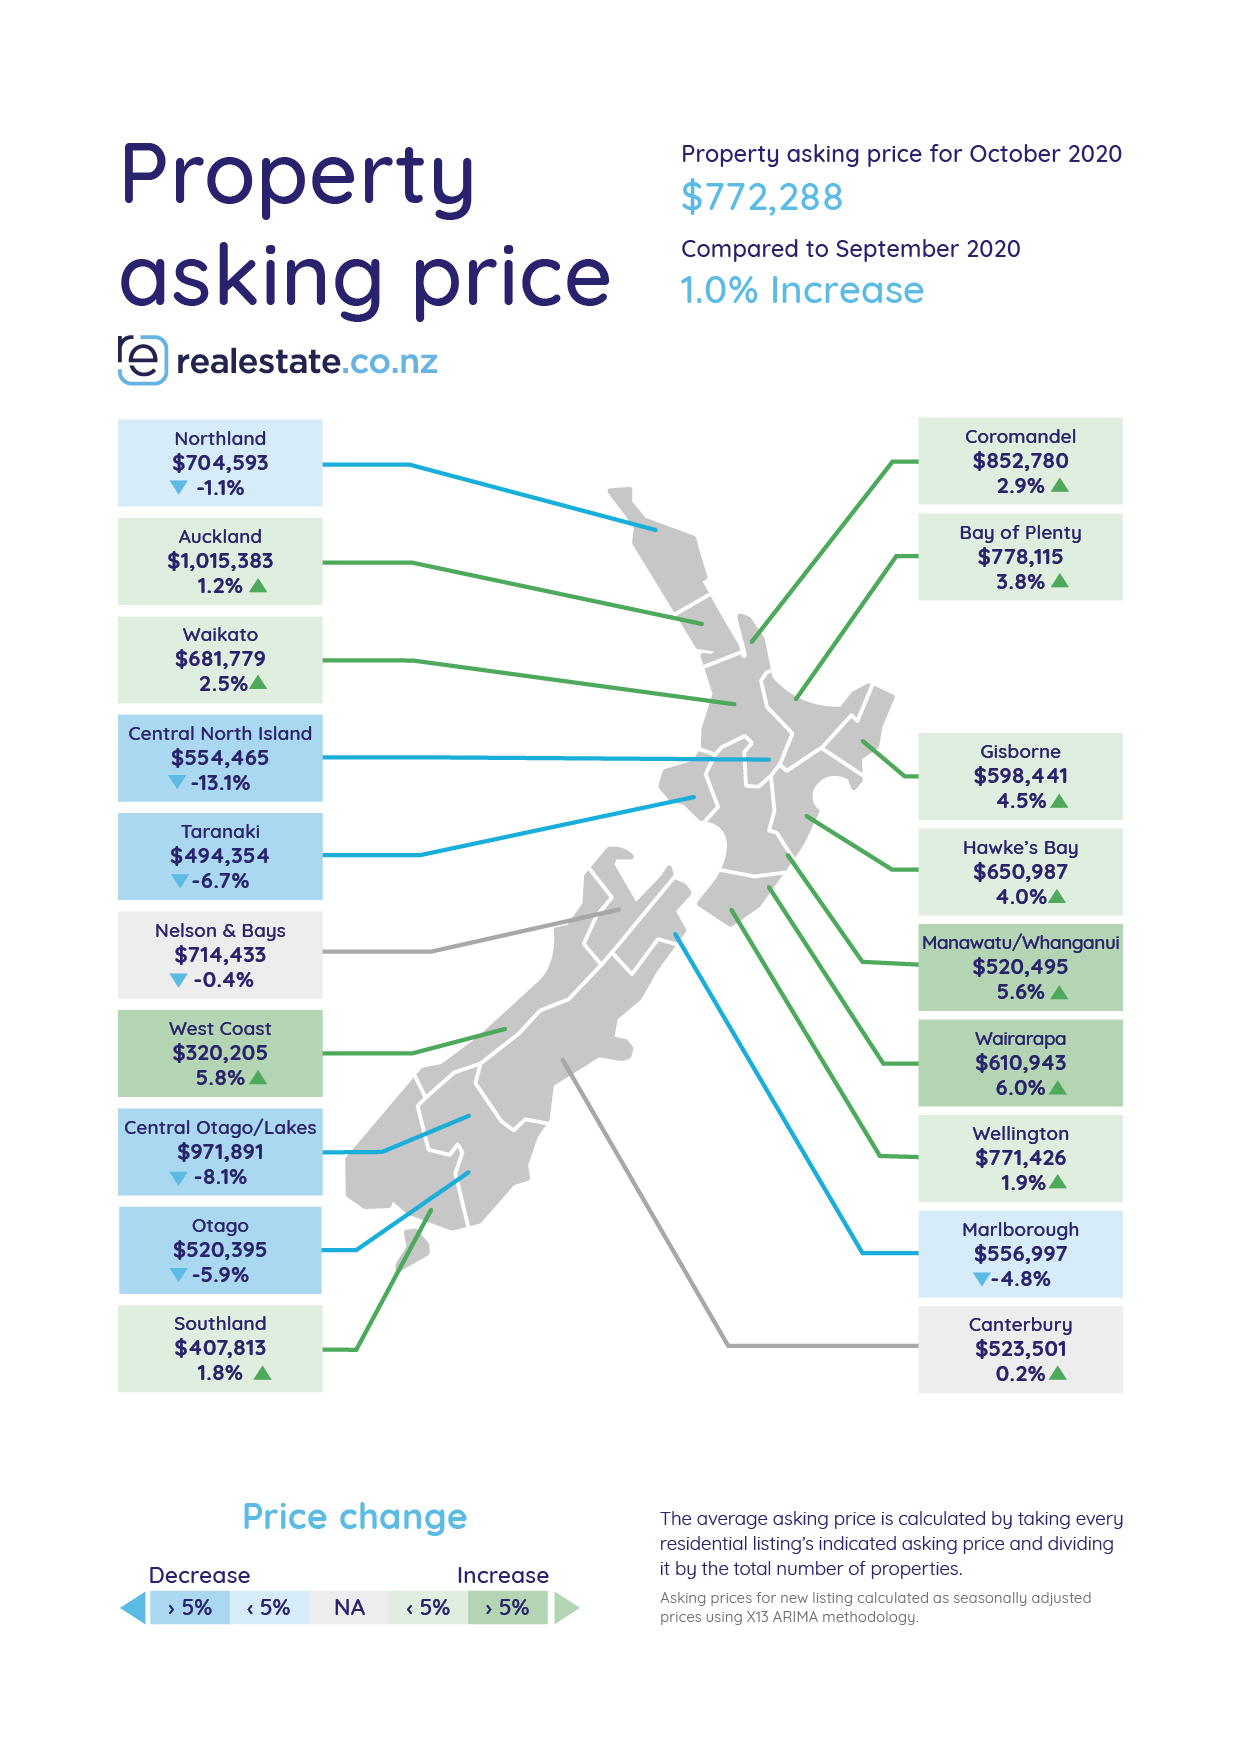
The national average asking price (not seasonally adjusted) was $772,288 in October, still well below the record of $858,432 set in April and still slightly below the August average of $824,702.
However record asking prices were set in six regions - Auckland, Waikato, Bay of Plenty, Hawke's Bay, Wairarapa and Manawatu/Whanganui (see the second chart below for the full regional figures).
The biggest decline in asking prices was in the central North Island where it was down 13.1% compared to October last year, followed by Queenstown-Lakes -8.1%.
However, although the number of new listings picked up significantly in October, total stock levels remain relatively tight.
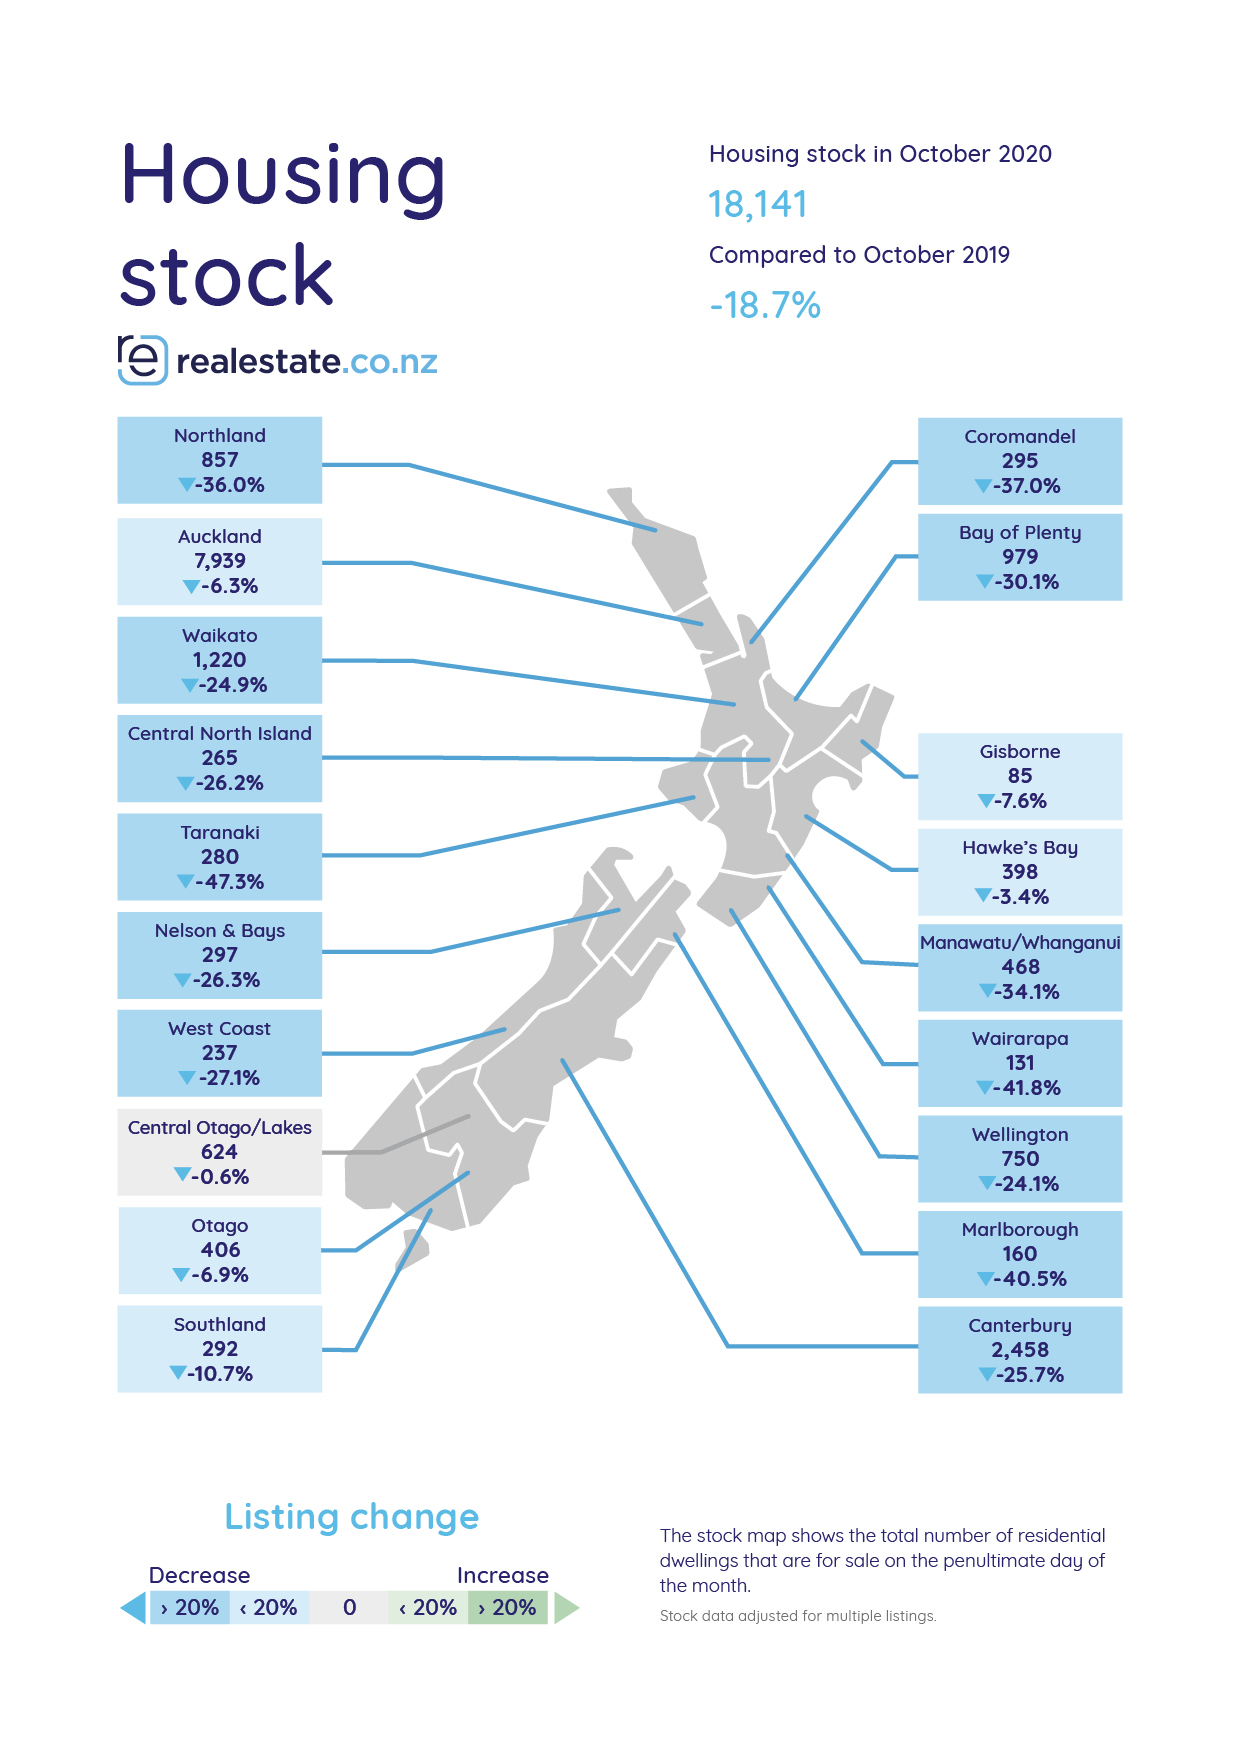
Realestate.co.nz had a total of 18,141 residential properties available for sale at the end of October, up 3.21% compared to September but still down 18.7% compared to October last year.
In Auckland the strong surge in new listings meant total stock increased by 6.98% compared to September but remained down by 6.3% compared to October last year (see the third chart below for the full regional figures).
Overall, the latest figures suggest the buoyant market that has been evident over spring looks set to continue into the summer months.
The comment stream on this story is now closed.
We welcome your comments below. If you are not already registered, please register to comment
Remember we welcome robust, respectful and insightful debate. We don't welcome abusive or defamatory comments and will de-register those repeatedly making such comments. Our current comment policy is here.