

The latest House Price Index (HPI) figures from the Real Estate Institute of New Zealand (REINZ) paint an uncertain picture of which way prices could be headed this winter.
The REINZ’s HPI is probably the best indicator we have of changes in the direction of house prices.
That’s because it takes into account changes in the mix of properties sold each month, unlike median or average prices, which can move up or down even when there is no movement in the underlying prices of individual properties.
And because the HPI is based on each month’s sales as they become unconditional, it reacts very quickly to price movements in the market compared to other measures based on quarterly data, which provide a good long term perspective on trends but respond more slowly to changes in market pricing.
Essentially what that means is if there’s a change in the direction of house prices, it should show up pretty quickly in the REINZ’s HPI.
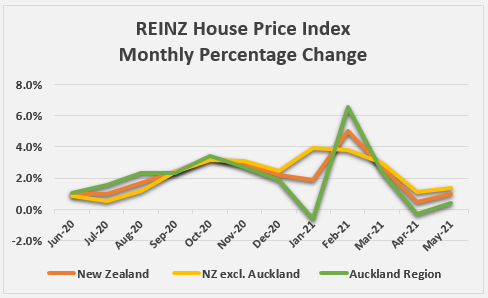
The graph below shows the monthly percentage change in the HPI for the Auckland region, the rest of New Zealand excluding Auckland, and the entire country in each of the 12 months from June last year to May this year.
It shows prices were rising strongly between July and October last year, with the rate of growth easing back slightly from October to the end of last year, before rocketing up in February this year.
That was followed by a sharp decline in price growth in March and April, with the figures for Auckland dipping into negative territory in April, suggesting overall prices in the region actually declined in April.
That sharp decline suggested a significant cooling in the market over March and April and that view would have been cemented in place if the decline had continued in May.
The trouble is, it didn’t.
As the graph shows, the HPI ticked up again in May.
Not by much, but enough to break the downward trend of the previous two months.
That makes crystal ball gazing on the direction of houses over the next few months particularly difficult.
If the HPI had continued its downward trend in May then there would have almost certainly been a sense that the market was continuing to cool.
But whether May’s upward tick in prices is the start of another upward trend, or a blip in a continuing slide, or maybe just a levelling off after a period of rapid gains, we will have to wait and see.
What the figures do suggest is that the huge price gains we saw early this year have now abated.
However there has not been a crash and most properties should have held onto the price gains that accrued over the last year.
There may even be some more price growth left, but if there is, it’s likely to be at much more modest levels than in the past.
But these are unusual times and old certainties no longer apply.
More than ever we are reminded of the old saying: Past performance is no guarantee of future results.
The comment stream on this story is now closed.
- You can have articles like this delivered directly to your inbox via our free Property Newsletter. We send it out 3-5 times a week with all of our property-related news, including auction results, interest rate movements and market commentary and analysis. To start receiving them, go to our email sign up page, scroll down to option 6 to select the Property Newsletter, enter your email address and hit the Sign Me Up button.
We welcome your comments below. If you are not already registered, please register to comment
Remember we welcome robust, respectful and insightful debate. We don't welcome abusive or defamatory comments and will de-register those repeatedly making such comments. Our current comment policy is here.