
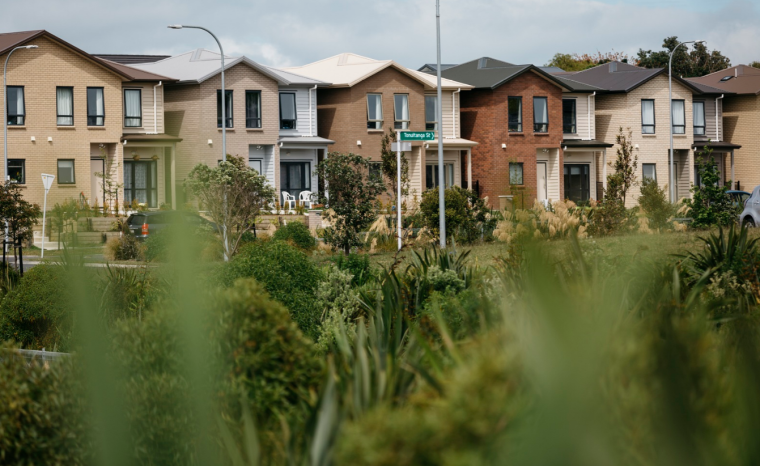
Housing values are continuing to rise at a significant clip, with the average value of New Zealand homes increasing by almost $15,000 in August.
According to the CoreLogic NZ House Price Index, the average value of New Zealand homes was $937,148 at the end of August, up $14,727 compared to July's average value of $922,421.
Over the 12 months to the end of August the average value of all New Zealand homes increased by 27%.
However while value growth remains high overall, the rate of growth has been declining and the latest figures show the first significant signs that values have started to decline in some areas.
The most notable declines are in Hamilton and Rotorua.
In Hamilton the average dwelling value declined from $805,503 in July to $782,774 in August, and average values in the city were 0.5% lower in August than they were three months earlier.
In Rotorua the average dwelling value declined from $650,546 in July to $644,390 in August, meaning average values in August were down by 2.8% compared to where they were three months earlier.
It is significant that both Hamilton and Rotorua have been popular locations for residential property investors in recent years and the recent decline in values in both cities may be a sign that changes to the tax treatment of residential investment properties and to loan-to-value ratio lending restrictions for investors, may be starting to have an effect.
However the latest Covid-19 Level 4 lockdown restrictions severely curtailed real estate activity over the last two weeks of August, making it difficult to pick ongoing market trends.
The restrictions are likely to have seen many prospective vendors postpone the sale of their properties but are less likely to have dented demand from buyers.
That could create a shortage of stock relative to demand, which could help maintain or even increase prices, at least until the market returns to a more normal footing once lockdown restrictions are eased.
The table below shows the average dwelling values in all major urban districts throughout New Zealand, and their change over three and 12 months.
CoreLogic's average values are a three month rolling average, based on sales data over the previous three months.
| CoreLogic NZ House Price Index | ||||
| Three Months Ended August 2021 | ||||
| Average current value $ | 3 month change % | 12 month change % | ||
| Territorial authority | ||||
| Far North | 613,098 | 7.3% | 25.7% | |
| Whangarei | 731,063 | 1.9% | 26.2% | |
| Kaipara | 800,180 | 9.9% | 33.2% | |
| Auckland - Rodney | 1,231,994 | 6.1% | 24.7% | |
| Rodney - Hibiscus Coast | 1,197,672 | 7.0% | 23.7% | |
| Rodney - North | 1,264,084 | 5.4% | 25.2% | |
| Auckland - North Shore | 1,496,346 | 4.3% | 22.0% | |
| North Shore - Coastal | 1,710,287 | 4.1% | 22.6% | |
| North Shore - North Harbour | 1,443,911 | 6.2% | 22.1% | |
| North Shore - Onewa | 1,219,428 | 3.4% | 21.7% | |
| Auckland - Waitakere | 1,080,574 | 5.9% | 26.3% | |
| Auckland - City | 1,579,648 | 6.5% | 25.7% | |
| Auckland City - Central | 1,334,480 | 7.0% | 22.6% | |
| Auckland City - Islands | 1,616,712 | 12.1% | 39.3% | |
| Auckland City - South | 1,436,635 | 7.0% | 26.9% | |
| Auckland_City - East | 1,979,169 | 5.4% | 25.5% | |
| Auckland - Manukau | 1,175,631 | 5.2% | 24.8% | |
| Manukau - Central | 932,876 | 6.1% | 26.9% | |
| Manukau - East | 1,502,440 | 4.1% | 25.2% | |
| Manukau - North West | 1,015,193 | 6.1% | 23.4% | |
| Auckland - Papakura | 926,841 | 5.7% | 25.8% | |
| Auckland - Franklin | 887,974 | 7.0% | 25.8% | |
| Thames Coromandel | 1,102,238 | 8.7% | 36.6% | |
| Hauraki | 629,396 | 23.7% | 37.7% | |
| Waikato | 677,055 | 5.5% | 28.1% | |
| Matamata Piako | 642,198 | 11.2% | 21.4% | |
| Hamilton | 782,774 | -0.5% | 21.8% | |
| Hamilton - Central & North West | 731,237 | -0.5% | 23.2% | |
| Hamilton - North East | 963,766 | 0.7% | 24.2% | |
| Hamilton - South East | 723,265 | -1.0% | 19.8% | |
| Hamilton - South West | 704,994 | -0.6% | 22.0% | |
| Waipa | 816,321 | 7.4% | 25.6% | |
| South Waikato | 404,238 | 7.8% | 28.0% | |
| Waitomo | 314,908 | -3.2% | 23.6% | |
| Taupo | 785,733 | 6.7% | 34.3% | |
| Western BOP | 904,741 | 6.7% | 28.2% | |
| Tauranga | 1,021,021 | 5.4% | 28.0% | |
| Rotorua | 644,390 | -2.8% | 19.9% | |
| Whakatane | 672,528 | -0.8% | 27.4% | |
| Kawerau | 410,618 | 12.0% | 31.4% | |
| Opotiki | 489,143 | 4.0% | 34.6% | |
| Gisborne | 599,244 | 1.4% | 38.2% | |
| Wairoa | 350,064 | -8.1% | 40.8% | |
| Hastings | 814,682 | 6.5% | 37.2% | |
| Napier | 827,381 | 3.9% | 34.1% | |
| Central Hawkes Bay | 545,867 | 4.8% | 26.3% | |
| New Plymouth | 655,515 | 3.5% | 27.4% | |
| Stratford | 451,414 | 2.7% | 28.0% | |
| South Taranaki | 394,799 | 5.7% | 38.6% | |
| Ruapehu | 370,685 | 8.3% | 38.2% | |
| Whanganui | 522,220 | 4.4% | 41.4% | |
| Rangitikei | 451,435 | 4.4% | 41.2% | |
| Manawatu | 628,138 | 4.2% | 32.3% | |
| Palmerston North | 725,185 | 5.9% | 39.1% | |
| Tararua | 449,708 | 6.9% | 52.2% | |
| Horowhenua | 615,126 | 5.4% | 38.2% | |
| Kapiti Coast | 919,741 | 2.0% | 36.8% | |
| Porirua | 953,891 | 6.4% | 37.8% | |
| Upper Hutt | 892,375 | 5.7% | 37.0% | |
| Hutt | 939,981 | 5.5% | 36.4% | |
| Wellington | 1,194,328 | 6.8% | 33.6% | |
| Wellington - Central & South | 1,126,711 | 3.7% | 27.1% | |
| Wellington - East | 1,305,567 | 8.7% | 37.3% | |
| Wellington - North | 1,133,660 | 8.9% | 37.7% | |
| Wellington - West | 1,372,414 | 7.3% | 36.8% | |
| Masterton | 631,501 | 6.3% | 42.4% | |
| Carterton | 681,566 | 1.1% | 38.3% | |
| South Wairarapa | 820,634 | 4.5% | 44.9% | |
| Tasman | 793,322 | 5.5% | 22.1% | |
| Nelson | 804,681 | 6.0% | 21.8% | |
| Marlborough | 677,987 | -0.6% | 29.3% | |
| Kaikoura | 603,438 | 12.6% | 26.5% | |
| Buller | 276,136 | 6.7% | 33.6% | |
| Grey | 331,159 | 15.8% | 42.2% | |
| Westland | 346,037 | 4.6% | 23.9% | |
| Hurunui | 497,487 | 0.0% | 19.9% | |
| Waimakariri | 602,588 | 9.7% | 29.2% | |
| Christchurch | 654,198 | 6.7% | 26.0% | |
| Christchurch - Banks Peninsula | 701,356 | 6.5% | 30.5% | |
| Christchurch - Central & North | 759,148 | 7.3% | 24.9% | |
| Christchurch - East | 504,469 | 6.8% | 28.3% | |
| Christchurch - Hills | 907,480 | 8.5% | 27.4% | |
| Christchurch - Southwest | 618,380 | 5.5% | 25.4% | |
| Selwyn | 719,355 | 7.6% | 26.1% | |
| Ashburton | 450,596 | 3.2% | 18.3% | |
| Timaru | 454,610 | 3.0% | 16.3% | |
| MacKenzie | 629,158 | 0.9% | 7.1% | |
| Waimate | 366,471 | 9.1% | 28.7% | |
| Waitaki | 440,272 | 4.4% | 22.6% | |
| Central Otago | 694,926 | 3.6% | 18.1% | |
| Queenstown Lakes | 1,391,079 | 3.4% | 23.3% | |
| Dunedin | 672,058 | 4.0% | 23.2% | |
| Dunedin - Central & North | 690,983 | 3.9% | 25.0% | |
| Dunedin - Peninsular & Coastal | 627,171 | 4.7% | 22.4% | |
| Dunedin - South | 642,154 | 3.7% | 23.8% | |
| Dunedin - Taieri | 696,549 | 4.1% | 20.9% | |
| Clutha | 374,121 | 11.0% | 25.5% | |
| Southland | 428,478 | 4.3% | 14.1% | |
| Gore | 369,098 | 9.9% | 28.8% | |
| Invercargill | 441,837 | 3.4% | 21.8% | |
| Auckland Area | 1,337,648 | 5.7% | 24.7% | |
| Main Urban Areas | 1,065,500 | 5.4% | 26.4% | |
| Wellington Area | 1,065,224 | 6.3% | 35.0% | |
| Total NZ | 937,148 | 5.2% | 27.0% | |
We welcome your comments below. If you are not already registered, please register to comment
Remember we welcome robust, respectful and insightful debate. We don't welcome abusive or defamatory comments and will de-register those repeatedly making such comments. Our current comment policy is here.