

This month's House Price Index (HPI) figures from the Real Estate Institute of New Zealand make for eye watering reading.
The HPI figures give a better indication of overall price movements in the housing market than either median or average prices, because they take into account changes in the mix of properties sold each month.
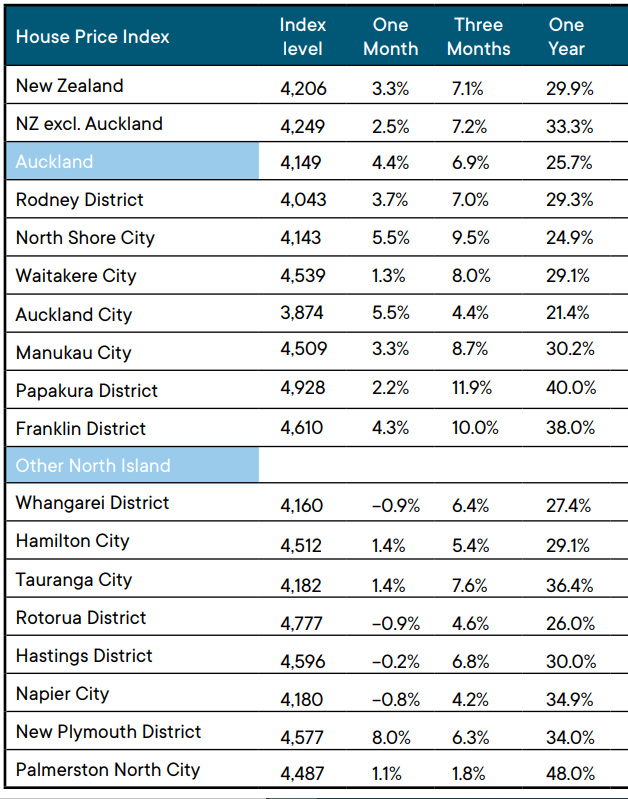
The most startling figures are those showing the price changes over the 12 months to October, with annual price growth hitting the 40% mark in a couple of places.
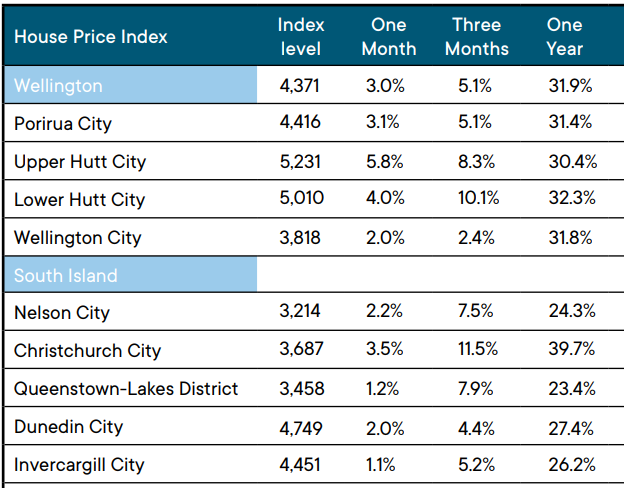
Palmerston North led the way with truly astonishing price growth of 48% over the last year, followed by Papakura on Auckland's southern flank at 40%. Not far behind were Christchurch at 39.7% and Franklin, also on Auckland's southern boundary, at 38%.
The average annual price growth for the whole country over the 12 months to the end of October was 29.9% and nowhere had annual price growth below 20% (see the table below for the full figures).
The main fuel for this bonfire of irrational exuberance has been microscopically low interest rates and the enthusiasm with which banks have been willing to lend people ever larger amounts of money.
If you have needed money to buy a home in the last year or so the banks have practically been giving it away.
However the drivers of the market are slowly changing.
Interest rates are starting to rise and lending criteria are tightening.
Supply and demand for housing are much more in balance as border closures have brought migration-driven population growth to a halt and developers continue to pump out the supply of new homes at a great pace, particularly in our biggest housing market, Auckland.
So are we at the peak of the current housing price cycle?
Unfortunately predicting house price movements is a bit like trying to read tea leaves after too many gins.
Over the last few months there have been plenty of commentators pointing out that while prices have continued to increase, their rate of growth has slowed, suggesting price pressures are starting to ease.
Then along came October's price figures and Boom!
The REINZ HPI shows prices in Auckland increased by 4.4% for the month and nationally they were up 3.3%.
True, the HPI posted declines for the month in Whangarei, Rotorua, Napier and Hastings. But apart from that, it was pedal to the metal for house prices in the rest of the country in October.
However prices can't remain detached from the market's underlying fundamentals forever.
If we are not at the peak of the current price cycle it's likely that we are not far off it, which is going to make for an interesting summer.
What remains to be seen is whether the peak will be followed by a price flattening, a modest decline or a sharp drop.
And the answer to that, I'm afraid, is written in the gin and tea leaves.
The comment stream on this story is now closed.
- You can have articles like this delivered directly to your inbox via our free Property Newsletter. We send it out 3-5 times a week with all of our property-related news, including auction results, interest rate movements and market commentary and analysis. To start receiving them, register (it's free) and when approved you can select any of our free email newsletters.
REINZ House Price Index October 2021

We welcome your comments below. If you are not already registered, please register to comment
Remember we welcome robust, respectful and insightful debate. We don't welcome abusive or defamatory comments and will de-register those repeatedly making such comments. Our current comment policy is here.