
There may be no shortage of predictions about house prices falling, but for now at least they remain just predictions.
The Real Estate Institute of New Zealand's national median selling price increased by $33,000 in November from October.
Some commentators have suggested that's because the bottom of the market has cooled and most of the activity is in the upper end of the market, pushing up the median.
However the REINZ's lower quartile selling price increased by a healthy $20,000 in November, suggesting the bottom end of the market is still trucking along at a decent clip too.
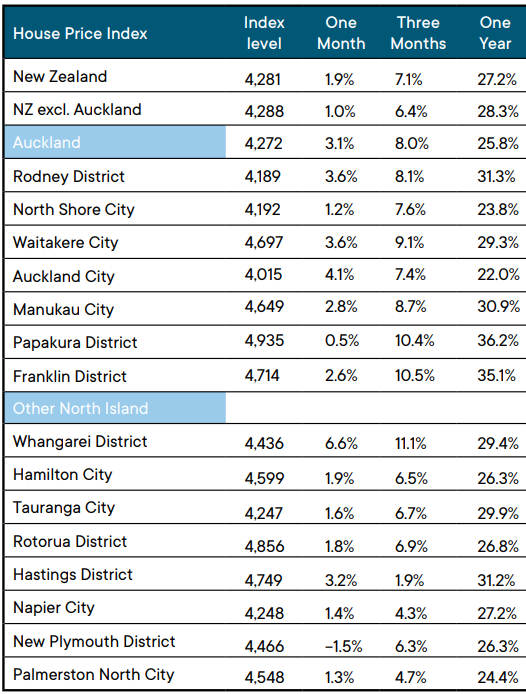
The REINZ's House Price Index (HPI), which adjusts for differences in the mix of properties sold each month, increased by 1.9% in the month of November. If it continued to increase at that rate this would give annualised price growth of around 25%.
That has led some commentators to point out that the rate of price growth is slowing, which could be a precursor to eventual price falls.
It's true that price growth has slowed.
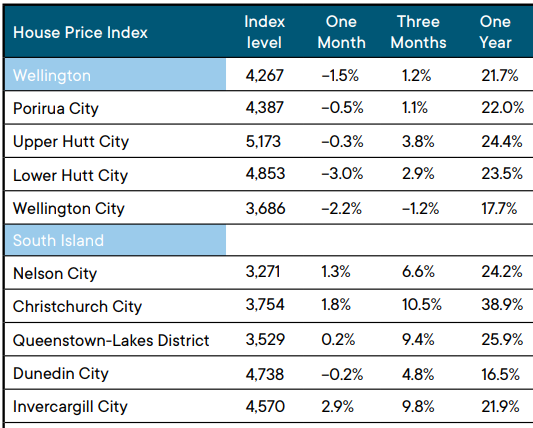
The REINZ's HPI increased by 1.9% in November compared to 3.3% in October (see the table below for the HPI figures for all main urban districts).
But the October increase was exceptional and after such a big jump in October you would expect it to ease off a bit the following month.
However the REINZ's monthly HPI figures can be a bit lumpy anyway.
A more reliable indication of price movement is the rolling three month HPI.
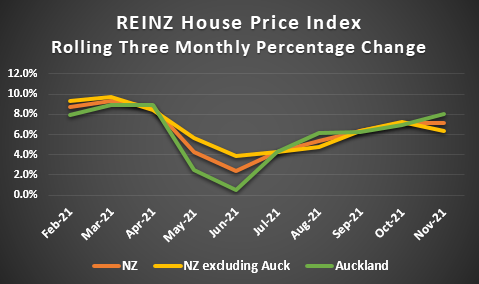
The graph below shows the percentage change in the REINZ HPI between February and November this year, for Auckland, the whole of NZ, and for all of NZ excluding Auckland.
What it shows is that over the three months to the end of November, compared to the three months ended October, price growth continued to increase in Auckland, declined slightly in the rest of New Zealand, and as might be expected in such a situation, flattened out nationally.
Those trends are also reflected in the monthly HPI figures, which show ongoing strong price growth in Auckland, with only slightly weaker growth in the rest of NZ and nationally.
The key trend the graph highlights is that price increases have remained in a narrow band of between 6% and 8% every three months for the last several months, and those rates of growth are still exceptionally high and would have to fall substantially before they were even close to indicating price falls.
However the latest monthly figures do indicate some soft spots in the market, notably all of the Wellington region where prices were in decline last month, and some regional centres such as New Plymouth, and Dunedin.
Unfortunately it could be three months or so before we get a clearer picture of where prices are heading.
The market is about to put on its pyjamas and curl up for its Christmas/New Year hibernation. Thus January's sales numbers will be minimal.
It will be February before sales return to a reasonable level and those numbers won't be finalised until the beginning of March.
And of course all bets are off if Covid-19 numbers head skyward and force us back into lockdown again.
In the meantime all we can do is put our feet up, pour ourselves a glass or two of festive cheer, and make the most of the Christmas break.
The comment stream on this story is now closed.
- You can have articles like this delivered directly to your inbox via our free Property Newsletter. We send it out 3-5 times a week with all of our property-related news, including auction results, interest rate movements and market commentary and analysis. To start receiving them, register here (it's free) and when approved you can select any of our free email newsletters.
REINZ House Price Index - November 2021
*This article was first published in our email for paying subscribers. See here for more details and how to subscribe.
We welcome your comments below. If you are not already registered, please register to comment
Remember we welcome robust, respectful and insightful debate. We don't welcome abusive or defamatory comments and will de-register those repeatedly making such comments. Our current comment policy is here.