
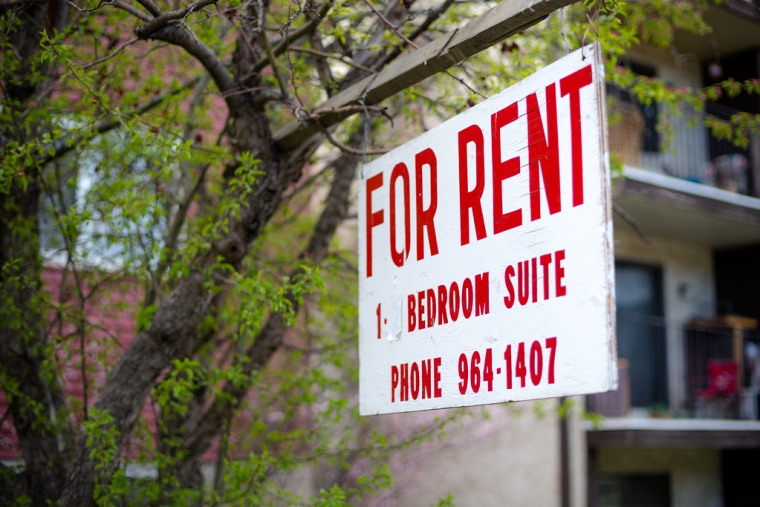

Residential property has become steadily more attractive to investors since the beginning of last year due to weaker property prices and rising rents.
Interest.co.nz matches the REINZ's lower quarter selling prices for the main property types - one and two bedroom apartments/units and three bedroom houses, with the median rents sourced from bond data for the same property types, to produce indicative gross rental yields for each of those property types in 41 major urban districts around the country.
A gross rental yield is a property's annual rental income expressed as a percentage of its purchase price and is a common measure used by investors to compare the income earning potential of different properties on an apples-with-apples basis.
The actual return they receive will depend on variables such as how much debt they take on and the terms of that debt, how much maintenance a property requires, vacancy levels and any other outgoings the investor faces.
However a gross rental yield is a useful tool to assess the relative attractiveness of rental property and how that changes over time.
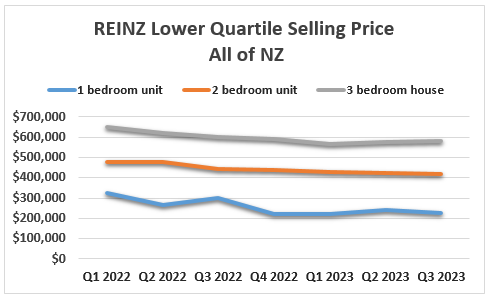
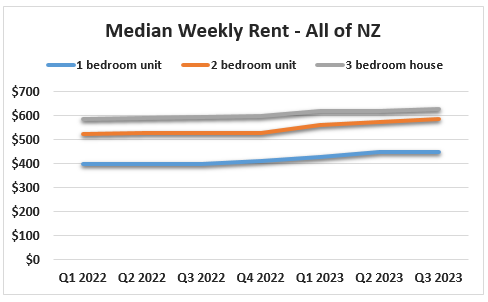
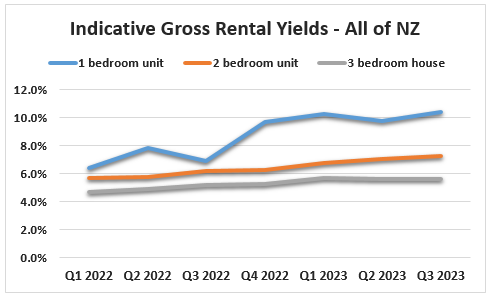
Interest.co.nz has been collating the data since the beginning of last year. Between the first quarter (Q1) of last year and Q3 this year, the national lower quartile price of three bedroom houses has decreased from $650,000 to $580,000. Over the same timeframe the median rent for newly tenanted three bedroom houses has increased from $589 to $630, pushing the yield up from 4.7% to 5.6% in the process.
The same trend is evident for multi-unit properties with the yield on one bedroom unit/apartments rising 6.4% to 10.4%, while the yield on two bedroom unit/apartments increased from 5.7% to 7.2%.
Those trends can clearly be seen in the three graphs below plotting the movements in lower quartile prices, median rents and gross yields for each of the above property types.
Similar trends are evident throughout New Zealand, with softer property prices and rising rents pushing up rental yields.
In Auckland, the country's largest rental market by far, the gross indicative yield on three bedroom houses has increased from a paltry 3.5% in Q1 2022 to a still modest 4.4% in Q3 2023. One bedroom units/apartments have gone form 6.2% to a whopping 12.5%, and two bedroom units/apartments have increased from 4.4% to 6.0% over the same period.
The table below shows the indicative yield trends by property type in all 41 urban areas monitored, including all of the council wards areas within the Auckland region.
Rising yields indicate an improvement in the income earning potential of a property. From that perspective, residential property has become a more attractive proposition for investors since the beginning of last year.
However, the currently high level of mortgage interest rates means it's likely to be investors with significant amounts of equity who are best placed to take advantage of that trend.
The comment stream on this story is now closed.

| Indicative Rental Yields | |||
| Gross rental yields for residential rental properties purchased at the REINZ's lower quartile selling price and rented at the median rent for each type of property in each district | |||
| Quarter | 1 bedroom unit/apartment | 2 Bedroom unit/apartment | 3 bedroom house |
| Whangarei District | |||
| Q1 2022 | 7.3% | 4.9% | 4.5% |
| Q2 2022 | 6.2% | 5.1% | 4.9% |
| Q3 2022 | 7.1% | 5.2% | 4.9% |
| Q4 2022 | 8.4% | 5.3% | 5.0% |
| Q1 2023 | 7.0% | 5.3% | 5.2% |
| Q2 2023 | 0.0% | 5.6% | 5.5% |
| Q3 2023 | 7.0% | 5.2% | 5.8% |
| Auckland Region | |||
| Q1 2022 | 6.2% | 4.4% | 3.5% |
| Q2 2022 | 13.6% | 4.5% | 3.7% |
| Q3 2022 | 7.2% | 4.6% | 3.9% |
| Q4 2022 | 11.2% | 4.8% | 4.0% |
| Q1 2023 | 11.8% | 5.3% | 4.2% |
| Q2 2023 | 13.4% | 5.6% | 4.3% |
| Q3 2023 | 12.5% | 6.0% | 4.4% |
| Auckland Council Ward Areas: | |||
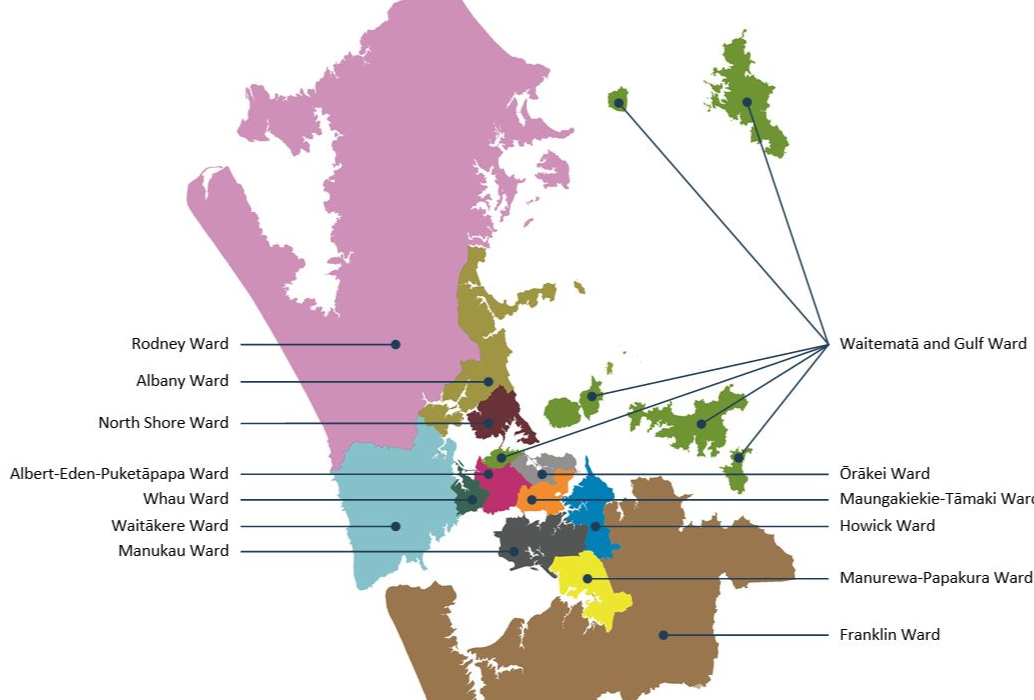
| See map below for ward boundaries | |||
| Auckland - Rodney Ward | |||
| Q1 2022 | 0.0% | 0.0% | 3.5% |
| Q2 2022 | 0.0% | 0.0% | 3.5% |
| Q3 2022 | 0.0% | 0.0% | 3.9% |
| Q4 2022 | 0.0% | 0.0% | 3.7% |
| Q1 2023 | 0.0% | 0.0% | 3.5% |
| Q2 2023 | 0.0% | 3.4% | 4.0% |
| Q3 2023 | 2.6% | 0.0% | 3.9% |
| Auckland - Albany Ward | |||
| Q1 2022 | 4.1% | 3.4% | 3.2% |
| Q2 2022 | 4.5% | 3.6% | 3.4% |
| Q3 2022 | 3.8% | 3.8% | 3.6% |
| Q4 2022 | 4.2% | 4.3% | 3.7% |
| Q1 2023 | 5.1% | 4.5% | 3.9% |
| Q2 2023 | 6.0% | 5.0% | 3.9% |
| Q3 2023 | 4.9% | 4.8% | 4.1% |
| Auckland - North Shore Ward | |||
| Q1 2022 | 3.9% | 3.5% | 3.1% |
| Q2 2022 | 4.2% | 3.9% | 3.3% |
| Q3 2022 | 4.6% | 4.1% | 3.4% |
| Q4 2022 | 4.2% | 4.1% | 3.5% |
| Q1 2023 | 6.0% | 4.1% | 3.7% |
| Q2 2023 | 5.2% | 4.6% | 3.9% |
| Q3 2023 | 4.7% | 5.0% | 3.9% |
| Auckland - Waitakere Ward | |||
| Q1 2022 | 16.7% | 3.4% | 3.3% |
| Q2 2022 | 5.1% | 3.6% | 3.6% |
| Q3 2022 | 0.0% | 4.8% | 3.7% |
| Q4 2022 | 0.0% | 4.1% | 3.8% |
| Q1 2023 | 3.5% | 4.7% | 4.0% |
| Q2 2023 | 0.0% | 5.3% | 4.4% |
| Q3 2023 | 0.0% | 5.1% | 4.2% |
| Auckland - Waitemata and Gulf Ward | |||
| Q1 2022 | 9.1% | 10.6% | 2.8% |
| Q2 2022 | 26.4% | 10.0% | 2.9% |
| Q3 2022 | 16.5% | 10.4% | 2.6% |
| Q4 2022 | 24.2% | 9.9% | 2.8% |
| Q1 2023 | 19.4% | 10.5% | 2.9% |
| Q2 2023 | 25.0% | 11.0% | 3.7% |
| Q3 2023 | 21.0% | 16.0% | 3.3% |
| Auckland - Whau Ward | |||
| Q1 2022 | 5.3% | 4.5% | 3.2% |
| Q2 2022 | 6.5% | 4.0% | 3.3% |
| Q3 2022 | 3.3% | 4.2% | 3.5% |
| Q4 2022 | 4.6% | 4.1% | 3.7% |
| Q1 2023 | 0.0% | 5.1% | 4.0% |
| Q2 2023 | 4.5% | 5.8% | 4.0% |
| Q3 2023 | 4.8% | 5.3% | 4.2% |
| Auckland - Albert-Eden-Puketapapa Ward | |||
| Q1 2022 | 4.2% | 4.0% | 2.9% |
| Q2 2022 | 4.2% | 3.9% | 3.1% |
| Q3 2022 | 4.9% | 4.1% | 3.2% |
| Q4 2022 | 4.7% | 4.5% | 3.1% |
| Q1 2023 | 5.0% | 4.9% | 3.4% |
| Q2 2023 | 4.9% | 4.8% | 3.9% |
| Q3 2023 | 5.7% | 5.2% | 3.7% |
| Auckland - Orakei Ward | |||
| Q1 2022 | 5.3% | 3.4% | 2.5% |
| Q2 2022 | 4.5% | 3.5% | 2.8% |
| Q3 2022 | 6.7% | 3.6% | 2.7% |
| Q4 2022 | 6.4% | 3.8% | 3.1% |
| Q1 2023 | 7.8% | 4.4% | 3.3% |
| Q2 2023 | 5.2% | 4.0% | 3.3% |
| Q3 2023 | 6.8% | 4.6% | 3.5% |
| Auckland - Maungakiekie-Tamaki Ward | |||
| Q1 2022 | 4.1% | 5.0% | 2.9% |
| Q2 2022 | 5.2% | 4.3% | 3.3% |
| Q3 2022 | 5.5% | 3.1% | 2.3% |
| Q4 2022 | 5.5% | 4.4% | 3.6% |
| Q1 2023 | 8.4% | 4.7% | 3.8% |
| Q2 2023 | 11.0% | 4.8% | 4.0% |
| Q3 2023 | 5.4% | 5.6% | 3.9% |
| Auckland - Howick Ward | |||
| Q1 2022 | 4.6% | 4.0% | 3.0% |
| Q2 2022 | 0.0% | 3.9% | 3.4% |
| Q3 2022 | 5.3% | 4.6% | 3.2% |
| Q4 2022 | 5.1% | 4.0% | 3.4% |
| Q1 2023 | 5.0% | 4.4% | 3.5% |
| Q2 2023 | 5.6% | 4.8% | 3.6% |
| Q3 2023 | 4.9% | 5.0% | 3.7% |
| Auckland - Manukau Ward | |||
| Q1 2022 | 5.1% | 4.1% | 3.8% |
| Q2 2022 | 5.5% | 4.3% | 4.0% |
| Q3 2022 | 5.4% | 5.1% | 4.3% |
| Q4 2022 | 5.5% | 4.7% | 4.5% |
| Q1 2023 | 6.0% | 5.0% | 4.6% |
| Q2 2023 | 6.9% | 5.8% | 4.8% |
| Q3 2023 | 6.1% | 5.8% | 4.7% |
| Auckland - Manurewa-Papakura Ward | |||
| Q1 2022 | 0.0% | 3.9% | 3.8% |
| Q2 2022 | 0.0% | 4.2% | 4.1% |
| Q3 2022 | 0.0% | 4.2% | 4.2% |
| Q4 2022 | 0.0% | 4.8% | 4.5% |
| Q1 2023 | 0.0% | 4.9% | 4.8% |
| Q2 2023 | 0.0% | 5.4% | 4.6% |
| Q3 2023 | 0.0% | 5.2% | 4.8% |
| Auckland - Franklin Ward | |||
| Q1 2022 | 4.3% | 3.5% | 3.8% |
| Q2 2022 | 0.0% | 0.0% | 3.7% |
| Q3 2022 | 0.0% | 4.1% | 4.0% |
| Q4 2022 | 0.0% | 0.0% | 4.1% |
| Q1 2023 | 0.0% | 0.0% | 4.3% |
| Q2 2023 | 0.0% | 0.0% | 4.4% |
| Q3 2023 | 0.0% | 5.7% | 4.3% |
| Hamilton City | |||
| Q1 2022 | 3.6% | 4.6% | 3.8% |
| Q2 2022 | 4.5% | 4.5% | 4.0% |
| Q3 2022 | 4.8% | 4.6% | 4.3% |
| Q4 2022 | 4.0% | 4.6% | 4.5% |
| Q1 2023 | 3.2% | 4.8% | 4.5% |
| Q2 2023 | 2.9% | 5.1% | 4.7% |
| Q3 2023 | 0.0% | 5.3% | 4.7% |
| Tauranga City | |||
| Q1 2022 | 3.6% | 4.7% | 3.8% |
| Q2 2022 | 3.4% | 4.4% | 4.1% |
| Q3 2022 | 2.7% | 4.7% | 4.4% |
| Q4 2022 | 8.4% | 4.5% | 4.6% |
| Q1 2023 | 5.7% | 5.0% | 4.5% |
| Q2 2023 | 6.6% | 5.6% | 4.8% |
| Q3 2023 | 4.2% | 6.1% | 4.9% |
| Whakatane District | |||
| Q1 2022 | 0.0% | 0.0% | 4.2% |
| Q2 2022 | 0.0% | 0.0% | 4.2% |
| Q3 2022 | 0.0% | 0.0% | 4.5% |
| Q4 2022 | 0.0% | 0.0% | 5.2% |
| Q1 2023 | 0.0% | 0.0% | 5.3% |
| Q2 2023 | 0.0% | 4.4% | 4.9% |
| Q3 2023 | 0.0% | 0.0% | 5.2% |
| Rotorua District | |||
| Q1 2022 | 0.0% | 5.8% | 5.2% |
| Q2 2022 | 0.0% | 5.7% | 5.2% |
| Q3 2022 | 1.9% | 7.9% | 5.5% |
| Q4 2022 | 2.8% | 5.4% | 5.6% |
| Q1 2023 | 0.0% | 6.5% | 6.4% |
| Q2 2023 | 0.0% | 6.4% | 5.8% |
| Q3 2023 | 3.6% | 6.2% | 6.0% |
| Hastings District | |||
| Q1 2022 | 0.0% | 0.0% | 4.7% |
| Q2 2022 | 0.0% | 5.1% | 4.7% |
| Q3 2022 | 0.0% | 0.0% | 5.0% |
| Q4 2022 | 0.0% | 5.0% | 5.2% |
| Q1 2023 | 0.0% | 5.5% | 5.5% |
| Q2 2023 | 0.0% | 5.8% | 5.2% |
| Q3 2023 | 0.0% | 4.4% | 5.7% |
| Napier City | |||
| Q1 2022 | 7.0% | 5.4% | 4.1% |
| Q2 2022 | 7.7% | 5.7% | 4.6% |
| Q3 2022 | 7.4% | 5.6% | 4.7% |
| Q4 2022 | 0.0% | 5.0% | 4.8% |
| Q1 2023 | 0.0% | 6.9% | 5.2% |
| Q2 2023 | 5.4% | 6.0% | 5.4% |
| Q3 2023 | 7.1% | 7.3% | 5.6% |
| Taupo District | |||
| Q1 2022 | 0.0% | 4.6% | 3.9% |
| Q2 2022 | 0.0% | 3.4% | 3.8% |
| Q3 2022 | 0.0% | 3.7% | 4.1% |
| Q4 2022 | 0.0% | 0.0% | 3.9% |
| Q1 2023 | 0.0% | 4.3% | 4.6% |
| Q2 2023 | 0.0% | 0.0% | 4.4% |
| Q3 2023 | 11.1% | 0.0% | 4.8% |
| New Plymouth District | |||
| Q1 2022 | 5.1% | 4.4% | 4.7% |
| Q2 2022 | 0.0% | 5.3% | 5.0% |
| Q3 2022 | 0.0% | 5.3% | 5.1% |
| Q4 2022 | 7.6% | 6.1% | 5.2% |
| Q1 2023 | 0.0% | 7.2% | 5.5% |
| Q2 2023 | 0.0% | 6.7% | 5.9% |
| Q3 2023 | 4.8% | 5.9% | 6.2% |
| Whanganui District | |||
| Q1 2022 | 6.8% | 4.8% | 5.2% |
| Q2 2022 | 0.0% | 4.8% | 5.3% |
| Q3 2022 | 6.0% | 5.1% | 6.1% |
| Q4 2022 | 9.7% | 6.8% | 6.3% |
| Q1 2023 | 8.3% | 7.2% | 6.3% |
| Q2 2023 | 8.3% | 6.8% | 6.9% |
| Q3 2023 | 0.0% | 7.8% | 6.5% |
| Palmerston North City | |||
| Q1 2022 | 0.0% | 4.3% | 4.6% |
| Q2 2022 | 3.0% | 4.9% | 4.9% |
| Q3 2022 | 0.0% | 5.7% | 5.3% |
| Q4 2022 | 0.0% | 6.8% | 5.3% |
| Q1 2023 | 0.0% | 6.2% | 5.7% |
| Q2 2023 | 4.3% | 5.9% | 6.0% |
| Q3 2023 | 0.0% | 6.3% | 5.5% |
| Kapiti Coast District | |||
| Q1 2022 | 0.0% | 0.0% | 4.0% |
| Q2 2022 | 0.0% | 0.0% | 4.4% |
| Q3 2022 | 0.0% | 0.0% | 4.4% |
| Q4 2022 | 0.0% | 4.4% | 4.4% |
| Q1 2023 | 0.0% | 0.0% | 4.8% |
| Q2 2023 | 0.0% | 4.5% | 5.0% |
| Q3 2023 | 0.0% | 5.2% | 5.5% |
| Porirua City | |||
| Q1 2022 | 0.0% | 0.0% | 4.3% |
| Q2 2022 | 0.0% | 3.3% | 4.8% |
| Q3 2022 | 0.0% | 4.4% | 5.4% |
| Q4 2022 | 0.0% | 0.0% | 4.9% |
| Q1 2023 | 0.0% | 0.0% | 5.0% |
| Q2 2023 | 0.0% | 0.0% | 5.3% |
| Q3 2023 | 0.0% | 0.0% | 5.1% |
| Upper Hutt City | |||
| Q1 2022 | 0.0% | 0.0% | 4.4% |
| Q2 2022 | 0.0% | 0.0% | 4.7% |
| Q3 2022 | 0.0% | 5.6% | 4.9% |
| Q4 2022 | 0.0% | 6.3% | 5.2% |
| Q1 2023 | 0.0% | 5.7% | 5.6% |
| Q2 2023 | 0.0% | 6.7% | 5.3% |
| Q3 2023 | 0.0% | 7.2% | 5.2% |
| Lower Hutt City | |||
| Q1 2022 | 4.5% | 4.5% | 4.3% |
| Q2 2022 | 5.5% | 5.3% | 4.7% |
| Q3 2022 | 7.4% | 6.2% | 5.2% |
| Q4 2022 | 10.5% | 6.4% | 5.6% |
| Q1 2023 | 6.6% | 7.1% | 5.8% |
| Q2 2023 | 6.3% | 6.2% | 5.5% |
| Q3 2023 | 7.9% | 7.7% | 5.8% |
| Wellington City | |||
| Q1 2022 | 6.3% | 5.0% | 4.1% |
| Q2 2022 | 6.2% | 5.4% | 4.3% |
| Q3 2022 | 7.1% | 6.1% | 4.6% |
| Q4 2022 | 8.4% | 5.4% | 4.8% |
| Q1 2023 | 7.8% | 6.4% | 4.9% |
| Q2 2023 | 7.9% | 6.5% | 5.1% |
| Q3 2023 | 8.4% | 6.4% | 4.9% |
| Nelson City | |||
| Q1 2022 | 6.0% | 4.4% | 4.2% |
| Q2 2022 | 6.0% | 4.6% | 4.2% |
| Q3 2022 | 6.5% | 5.9% | 4.5% |
| Q4 2022 | 6.4% | 6.2% | 4.6% |
| Q1 2023 | 4.7% | 5.7% | 4.7% |
| Q2 2023 | 4.0% | 5.0% | 4.8% |
| Q3 2023 | 3.2% | 5.8% | 4.8% |
| Marlborough District | |||
| Q1 2022 | 0.0% | 0.0% | 4.3% |
| Q2 2022 | 0.0% | 0.0% | 4.2% |
| Q3 2022 | 0.0% | 5.1% | 5.0% |
| Q4 2022 | 0.0% | 0.0% | 4.5% |
| Q1 2023 | 0.0% | 6.4% | 4.9% |
| Q2 2023 | 0.0% | 0.0% | 5.1% |
| Q3 2023 | 0.0% | 6.2% | 4.9% |
| Waimakariri District | |||
| Q1 2022 | 0.0% | 0.0% | 4.3% |
| Q2 2022 | 0.0% | 0.0% | 4.2% |
| Q3 2022 | 0.0% | 0.0% | 4.4% |
| Q4 2022 | 0.0% | 0.0% | 4.3% |
| Q1 2023 | 0.0% | 0.0% | 4.8% |
| Q2 2023 | 0.0% | 0.0% | 4.9% |
| Q3 2023 | 0.0% | 0.0% | 4.8% |
| Christchurch City | |||
| Q1 2022 | 4.9% | 5.4% | 4.3% |
| Q2 2022 | 6.2% | 5.7% | 4.6% |
| Q3 2022 | 5.6% | 5.5% | 4.7% |
| Q4 2022 | 5.4% | 5.8% | 4.9% |
| Q1 2023 | 5.8% | 6.4% | 5.1% |
| Q2 2023 | 5.5% | 6.3% | 5.2% |
| Q3 2023 | 5.9% | 6.6% | 5.2% |
| Selwyn District | |||
| Q1 2022 | 0.0% | 0.0% | 3.9% |
| Q2 2022 | 0.0% | 0.0% | 3.9% |
| Q3 2022 | 0.0% | 0.0% | 4.0% |
| Q4 2022 | 0.0% | 0.0% | 4.4% |
| Q1 2023 | 0.0% | 0.0% | 4.2% |
| Q2 2023 | 0.0% | 0.0% | 4.4% |
| Q3 2023 | 0.0% | 0.0% | 4.4% |
| Ashburton District | |||
| Q1 2022 | 0.0% | 0.0% | 4.7% |
| Q2 2022 | 0.0% | 0.0% | 5.0% |
| Q3 2022 | 0.0% | 0.0% | 5.3% |
| Q4 2022 | 0.0% | 0.0% | 4.8% |
| Q1 2023 | 0.0% | 0.0% | 5.0% |
| Q2 2023 | 0.0% | 6.1% | 5.3% |
| Q3 2023 | 0.0% | 7.2% | 5.8% |
| Timaru District | |||
| Q1 2022 | 0.0% | 6.4% | 5.1% |
| Q2 2022 | 0.0% | 6.3% | 4.8% |
| Q3 2022 | 0.0% | 5.3% | 5.2% |
| Q4 2022 | 0.0% | 6.1% | 5.6% |
| Q1 2023 | 0.0% | 6.6% | 5.4% |
| Q2 2023 | 0.0% | 6.7% | 5.2% |
| Q3 2023 | 0.0% | 5.4% | 5.4% |
| Queenstown-Lakes District | |||
| Q1 2022 | 4.4% | 4.1% | 3.2% |
| Q2 2022 | 4.8% | 4.8% | 3.3% |
| Q3 2022 | 7.4% | 4.3% | 3.6% |
| Q4 2022 | 4.8% | 4.7% | 3.8% |
| Q1 2023 | 8.8% | 5.0% | 3.9% |
| Q2 2023 | 5.2% | 5.5% | 4.1% |
| Q3 2023 | 9.1% | 6.1% | 3.9% |
| Dunedin City | |||
| Q1 2022 | 5.0% | 6.4% | 4.7% |
| Q2 2022 | 4.3% | 5.6% | 4.8% |
| Q3 2022 | 4.6% | 6.0% | 5.4% |
| Q4 2022 | 4.2% | 7.4% | 5.6% |
| Q1 2023 | 5.8% | 6.6% | 5.9% |
| Q2 2023 | 5.5% | 6.0% | 5.9% |
| Q3 2023 | 4.9% | 5.0% | 5.8% |
| Invercargill City | |||
| Q1 2022 | 8.8% | 6.1% | 5.9% |
| Q2 2022 | 11.9% | 7.0% | 6.1% |
| Q3 2022 | 8.7% | 6.8% | 6.0% |
| Q4 2022 | 0.0% | 7.3% | 6.0% |
| Q1 2023 | 0.0% | 6.4% | 6.8% |
| Q2 2023 | 0.0% | 6.2% | 6.5% |
| Q3 2023 | 9.7% | 7.4% | 6.5% |
| Total - All of Aotearoa | |||
| Q1 2022 | 6.4% | 5.7% | 4.7% |
| Q2 2022 | 7.8% | 5.7% | 4.9% |
| Q3 2022 | 6.9% | 6.2% | 5.2% |
| Q4 2022 | 9.7% | 6.3% | 5.3% |
| Q1 2023 | 10.2% | 6.8% | 5.7% |
| Q2 2023 | 9.8% | 7.1% | 5.6% |
| Q3 2023 | 10.4% | 7.2% | 5.6% |
| Note: The price data used to calculate the yield figures in this report is provided by the Real Estate Institute of New Zealand (REINZ), home of the most complete, accurate and up-to-date real estate data in New Zealand. | |||
Auckland Council Wards Map
- You can have articles like this delivered directly to your inbox via our free Property Newsletter. We send it out 3-5 times a week with all of our property-related news, including auction results, interest rate movements and market commentary and analysis. To start receiving them, register here (it's free) and when approved you can select any of our free email newsletters.
We welcome your comments below. If you are not already registered, please register to comment
Remember we welcome robust, respectful and insightful debate. We don't welcome abusive or defamatory comments and will de-register those repeatedly making such comments. Our current comment policy is here.