
The fundamental attractiveness of residential property as an investment tended to flatten out at the end of last year, after 18 months of steady improvement.
Interest.co.nz tracks the theoretical rental yields that would be achieved on the three main types of rental properties (one bedroom units, two bedroom units and three bedroom houses), nationally and in all of the main urban districts around the country each quarter.
Using lower quarter selling price data for each type of property from the Real Estate Institute of NZ and matching that with median rent data from bonds received by Tenancy Services each month, provides an indicative rental yield for each type of property in each district.
This allows us to track the relative attractiveness of the rental property market each quarter, using a standard measure based on actual market movements.
A rental yield measures a property's income earning potential relative to its purchase price, making it a fundamental indicator of the rental market.
But it is not a measure of individual cash flows, which are affected by such things as how much debt an investor takes on, movements in mortgage interest costs, vacancy rates and outgoings such as rates, insurance and maintenance.
Over the last couple of years most of the attention has been focused on the costs of owning rental property because they have been steadily increasing.
But what has often been missed is the fact that the fundamental attractiveness of residential investment property as an income producing asset has been steadily improving.
That's because property prices have been generally declining, while rents have been generally increasing.
In the first quarter (Q1) of 2022 the Real Estate Institute of New Zealand's national lower quartile selling price for three bedroom houses was $650,000, while the median rent for three bedroom houses in the same quarter was $589 a week, giving a gross yield of 4.7%.
A year later in Q1 2023, the national lower quartile price for three bedroom houses had dropped to $566,050 while the median rent for the same type of properties had increased to $620 a week, pushing the gross yield up to 5.7%.
It dropped back down to 5.6% in Q2 2023 and stayed there for the rest of year, suggesting a period of relative stability in the rental market, with prices and rents moving in tandem.
However 5.6% is not a particularly attractive gross return for investors looking for income, especially when they are facing significant increases in outgoings and uncertain prospects for capital gains.
However better returns are available on multi-unit properties such as home units.
The national yields on two bedroom units increased from 5.7% in Q1 2022 to 7.2% in Q3 2023, before dropping back to 6.8% in Q4 2023, while yields on one bedroom units rose from 6.4% in Q1 2022 to 10.4% in Q3 2023 , then dropped back to 8.7% in Q4 2023.
There are also major differences in yields depending on location.
For example, in Auckland, where property prices are extremely high relative to rents, the yields on three bedroom houses rose from a paltry 3.5% in Q1 2022 to a measly 4.4% in Q4 2023, so good luck to anyone trying to squeeze a decent income out of that.
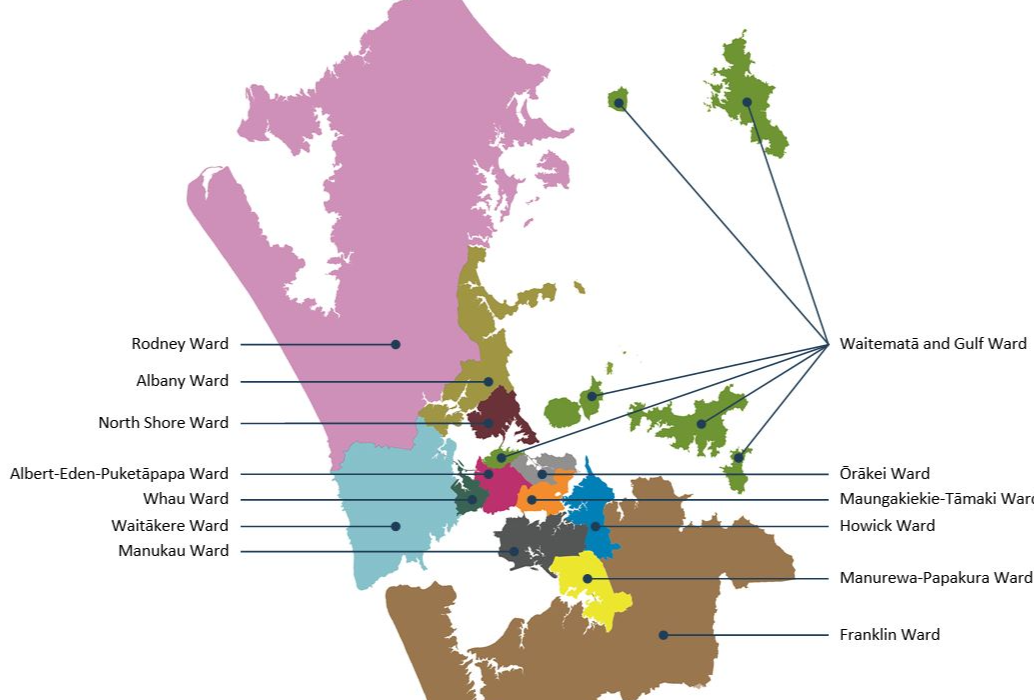
The table below shows the quarterly movements in indicative yields for the three main rental property types in all of the country's main urban districts, including each of the council wards within Auckland City.
The comment stream on this story is now closed.

| Whangarei District | |||
| Quarter | 1 brm unit | 2 brm unit | 3 brm house |
| Q1 2022 | 7.3% | 4.9% | 4.5% |
| Q2 2022 | 6.2% | 5.1% | 4.9% |
| Q3 2022 | 7.1% | 5.2% | 4.9% |
| Q4 2022 | 8.4% | 5.3% | 5.0% |
| Q1 2023 | 7.0% | 5.3% | 5.2% |
| Q2 2023 | 0.0% | 5.6% | 5.5% |
| Q3 2023 | 7.0% | 5.2% | 5.8% |
| Q4 2023 | 0.0% | 6.0% | 5.6% |
| Auckland Region | |||
| Separate figures for each Auckland Council ward area are at the bottom of this table | |||
| Quarter | 1 brm unit | 2 brm unit | 3 brm house |
| Q1 2022 | 6.2% | 4.4% | 3.5% |
| Q2 2022 | 13.6% | 4.5% | 3.7% |
| Q3 2022 | 7.2% | 4.6% | 3.9% |
| Q4 2022 | 11.2% | 4.8% | 4.0% |
| Q1 2023 | 11.8% | 5.3% | 4.2% |
| Q2 2023 | 13.4% | 5.6% | 4.3% |
| Q3 2023 | 12.5% | 6.0% | 4.4% |
| Q4 2023 | 9.6% | 5.3% | 4.4% |
| Hamilton City | |||
| Quarter | 1 brm unit | 2 brm unit | 3 brm house |
| Q1 2022 | 3.6% | 4.6% | 3.8% |
| Q2 2022 | 4.5% | 4.5% | 4.0% |
| Q3 2022 | 4.8% | 4.6% | 4.3% |
| Q4 2022 | 4.0% | 4.6% | 4.5% |
| Q1 2023 | 3.2% | 4.8% | 4.5% |
| Q2 2023 | 2.9% | 5.1% | 4.7% |
| Q3 2023 | 0.0% | 5.3% | 4.7% |
| Q4 2023 | 6.5% | 5.3% | 4.7% |
| Tauranga City | |||
| Quarter | 1 brm unit | 2 brm unit | 3 brm house |
| Q1 2022 | 3.6% | 4.7% | 3.8% |
| Q2 2022 | 3.4% | 4.4% | 4.1% |
| Q3 2022 | 2.7% | 4.7% | 4.4% |
| Q4 2022 | 8.4% | 4.5% | 4.6% |
| Q1 2023 | 5.7% | 5.0% | 4.5% |
| Q2 2023 | 6.6% | 5.6% | 4.8% |
| Q3 2023 | 4.2% | 6.1% | 4.9% |
| Q4 2023 | 6.6% | 5.4% | 4.8% |
| Whakatane District | |||
| Quarter | 1 brm unit | 2 brm unit | 3 brm house |
| Q1 2022 | 0.0% | 0.0% | 4.2% |
| Q2 2022 | 0.0% | 0.0% | 4.2% |
| Q3 2022 | 0.0% | 0.0% | 4.5% |
| Q4 2022 | 0.0% | 0.0% | 5.2% |
| Q1 2023 | 0.0% | 0.0% | 5.3% |
| Q2 2023 | 0.0% | 4.4% | 4.9% |
| Q3 2023 | 0.0% | 0.0% | 5.2% |
| Q4 2023 | 0.0% | 0.0% | 5.1% |
| Rotorua District | |||
| Quarter | 1 brm unit | 2 brm unit | 3 brm house |
| Q1 2022 | 0.0% | 5.8% | 5.2% |
| Q2 2022 | 0.0% | 5.7% | 5.2% |
| Q3 2022 | 1.9% | 7.9% | 5.5% |
| Q4 2022 | 2.8% | 5.4% | 5.6% |
| Q1 2023 | 0.0% | 6.5% | 6.4% |
| Q2 2023 | 0.0% | 6.4% | 5.8% |
| Q3 2023 | 3.6% | 6.2% | 6.0% |
| Q4 2023 | 0.0% | 6.2% | 6.0% |
| Taupo District | |||
| Quarter | 1 brm unit | 2 brm unit | 3 brm house |
| Q1 2022 | 0.0% | 4.6% | 3.9% |
| Q2 2022 | 0.0% | 3.4% | 3.8% |
| Q3 2022 | 0.0% | 3.7% | 4.1% |
| Q4 2022 | 0.0% | 0.0% | 3.9% |
| Q1 2023 | 0.0% | 4.3% | 4.6% |
| Q2 2023 | 0.0% | 0.0% | 4.4% |
| Q3 2023 | 11.1% | 0.0% | 4.8% |
| Q4 2023 | 0.0% | 7.5% | 4.8% |
| Hastings District | |||
| Quarter | 1 brm unit | 2 brm unit | 3 brm house |
| Q1 2022 | 0.0% | 4.7% | |
| Q2 2022 | 0.0% | 5.1% | 4.7% |
| Q3 2022 | 0.0% | 0.0% | 5.0% |
| Q4 2022 | 0.0% | 5.0% | 5.2% |
| Q1 2023 | 0.0% | 5.5% | 5.5% |
| Q2 2023 | 0.0% | 5.8% | 5.2% |
| Q3 2023 | 0.0% | 4.4% | 5.7% |
| Q4 2023 | 0.0% | 0.0% | 5.5% |
| Napier City | |||
| Quarter | 1 brm unit | 2 brm unit | 3 brm house |
| Q1 2022 | 7.0% | 5.4% | 4.1% |
| Q2 2022 | 7.7% | 5.7% | 4.6% |
| Q3 2022 | 7.4% | 5.6% | 4.7% |
| Q4 2022 | 0.0% | 5.0% | 4.8% |
| Q1 2023 | 0.0% | 6.9% | 5.2% |
| Q2 2023 | 5.4% | 6.0% | 5.4% |
| Q3 2023 | 7.1% | 7.3% | 5.6% |
| Q4 2023 | 6.8% | 6.3% | 5.4% |
| New Plymouth District | |||
| Quarter | 1 brm unit | 2 brm unit | 3 brm house |
| Q1 2022 | 5.1% | 4.4% | 4.7% |
| Q2 2022 | 0.0% | 5.3% | 5.0% |
| Q3 2022 | 0.0% | 5.3% | 5.1% |
| Q4 2022 | 7.6% | 6.1% | 5.2% |
| Q1 2023 | 0.0% | 7.2% | 5.5% |
| Q2 2023 | 0.0% | 6.7% | 5.9% |
| Q3 2023 | 4.8% | 5.9% | 6.2% |
| Q4 2023 | 7.1% | 6.7% | 5.9% |
| Whanganui District | |||
| Quarter | 1 brm unit | 2 brm unit | 3 brm house |
| Q1 2022 | 6.8% | 4.8% | 5.2% |
| Q2 2022 | 4.8% | 5.3% | |
| Q3 2022 | 6.0% | 5.1% | 6.1% |
| Q4 2022 | 9.7% | 6.8% | 6.3% |
| Q1 2023 | 8.3% | 7.2% | 6.3% |
| Q2 2023 | 8.3% | 6.8% | 6.9% |
| Q3 2023 | 7.8% | 6.5% | |
| Q4 2023 | 6.2% | 6.8% | 7.0% |
| Palmerston North City | |||
| Quarter | 1 brm unit | 2 brm unit | 3 brm house |
| Q1 2022 | 0.0% | 4.3% | 4.6% |
| Q2 2022 | 3.0% | 4.9% | 4.9% |
| Q3 2022 | 0.0% | 5.7% | 5.3% |
| Q4 2022 | 0.0% | 6.8% | 5.3% |
| Q1 2023 | 0.0% | 6.2% | 5.7% |
| Q2 2023 | 4.3% | 5.9% | 6.0% |
| Q3 2023 | 0.0% | 6.3% | 5.5% |
| Q4 2023 | 0.0% | 6.8% | 5.8% |
| Kapiti Coast District | |||
| Quarter | 1 brm unit | 2 brm unit | 3 brm house |
| Q1 2022 | 0.0% | 0.0% | 4.0% |
| Q2 2022 | 0.0% | 0.0% | 4.4% |
| Q3 2022 | 0.0% | 0.0% | 4.4% |
| Q4 2022 | 0.0% | 4.4% | 4.4% |
| Q1 2023 | 0.0% | 0.0% | 4.8% |
| Q2 2023 | 0.0% | 4.5% | 5.0% |
| Q3 2023 | 0.0% | 5.2% | 5.5% |
| Q4 2023 | 0.0% | 5.4% | 4.9% |
| Porirua City | |||
| Quarter | 1 brm unit | 2 brm unit | 3 brm house |
| Q1 2022 | 0.0% | 0.0% | 4.3% |
| Q2 2022 | 0.0% | 3.3% | 4.8% |
| Q3 2022 | 0.0% | 4.4% | 5.4% |
| Q4 2022 | 0.0% | 0.0% | 4.9% |
| Q1 2023 | 0.0% | 0.0% | 5.0% |
| Q2 2023 | 0.0% | 0.0% | 5.3% |
| Q3 2023 | 0.0% | 0.0% | 5.1% |
| Q4 2023 | 0.0% | 0.0% | 5.6% |
| Upper Hutt City | |||
| Quarter | 1 brm unit | 2 brm unit | 3 brm house |
| Q1 2022 | 0.0% | 0.0% | 4.4% |
| Q2 2022 | 0.0% | 0.0% | 4.7% |
| Q3 2022 | 0.0% | 5.6% | 4.9% |
| Q4 2022 | 0.0% | 6.3% | 5.2% |
| Q1 2023 | 0.0% | 5.7% | 5.6% |
| Q2 2023 | 0.0% | 6.7% | 5.3% |
| Q3 2023 | 0.0% | 7.2% | 5.2% |
| Q4 2023 | 0.0% | 0.0% | 5.4% |
| Lower Hutt City | |||
| Quarter | 1 brm unit | 2 brm unit | 3 brm house |
| Q1 2022 | 4.5% | 4.5% | 4.3% |
| Q2 2022 | 5.5% | 5.3% | 4.7% |
| Q3 2022 | 7.4% | 6.2% | 5.2% |
| Q4 2022 | 10.5% | 6.4% | 5.6% |
| Q1 2023 | 6.6% | 7.1% | 5.8% |
| Q2 2023 | 6.3% | 6.2% | 5.5% |
| Q3 2023 | 7.9% | 7.7% | 5.8% |
| Q4 2023 | 7.5% | 6.8% | 5.6% |
| Wellington City | |||
| Quarter | 1 brm unit | 2 brm unit | 3 brm house |
| Q1 2022 | 6.3% | 5.0% | 4.1% |
| Q2 2022 | 6.2% | 5.4% | 4.3% |
| Q3 2022 | 7.1% | 6.1% | 4.6% |
| Q4 2022 | 8.4% | 5.4% | 4.8% |
| Q1 2023 | 7.8% | 6.4% | 4.9% |
| Q2 2023 | 7.9% | 6.5% | 5.1% |
| Q3 2023 | 8.4% | 6.4% | 4.9% |
| Q4 2023 | 7.4% | 6.3% | 4.7% |
| Nelson City | |||
| Quarter | 1 brm unit | 2 brm unit | 3 brm house |
| Q1 2022 | 6.0% | 4.4% | 4.2% |
| Q2 2022 | 6.0% | 4.6% | 4.2% |
| Q3 2022 | 6.5% | 5.9% | 4.5% |
| Q4 2022 | 6.4% | 6.2% | 4.6% |
| Q1 2023 | 4.7% | 5.7% | 4.7% |
| Q2 2023 | 4.0% | 5.0% | 4.8% |
| Q3 2023 | 3.2% | 5.8% | 4.8% |
| Q4 2023 | 4.1% | 5.6% | 4.7% |
| Marlborough District | |||
| Quarter | 1 brm unit | 2 brm unit | 3 brm house |
| Q1 2022 | 0.0% | 0.0% | 4.3% |
| Q2 2022 | 0.0% | 0.0% | 4.2% |
| Q3 2022 | 0.0% | 5.1% | 5.0% |
| Q4 2022 | 0.0% | 0.0% | 4.5% |
| Q1 2023 | 0.0% | 6.4% | 4.9% |
| Q2 2023 | 0.0% | 0.0% | 5.1% |
| Q3 2023 | 0.0% | 6.2% | 4.9% |
| Q4 2023 | 0.0% | 6.1% | 5.3% |
| Waimakariri District | |||
| Quarter | 1 brm unit | 2 brm unit | 3 brm house |
| Q1 2022 | 0.0% | 0.0% | 4.3% |
| Q2 2022 | 0.0% | 0.0% | 4.2% |
| Q3 2022 | 0.0% | 0.0% | 4.4% |
| Q4 2022 | 0.0% | 0.0% | 4.3% |
| Q1 2023 | 0.0% | 0.0% | 4.8% |
| Q2 2023 | 0.0% | 0.0% | 4.9% |
| Q3 2023 | 0.0% | 0.0% | 4.8% |
| Q4 2023 | 0.0% | 0.0% | 4.8% |
| Christchurch City | |||
| Quarter | 1 brm unit | 2 brm unit | 3 brm house |
| Q1 2022 | 4.9% | 5.4% | 4.3% |
| Q2 2022 | 6.2% | 5.7% | 4.6% |
| Q3 2022 | 5.6% | 5.5% | 4.7% |
| Q4 2022 | 5.4% | 5.8% | 4.9% |
| Q1 2023 | 5.8% | 6.4% | 5.1% |
| Q2 2023 | 5.5% | 6.3% | 5.2% |
| Q3 2023 | 5.9% | 6.6% | 5.2% |
| Q4 2023 | 6.2% | 6.0% | 5.1% |
| Selwyn District | |||
| Quarter | 1 brm unit | 2 brm unit | 3 brm house |
| Q1 2022 | 0.0% | 0.0% | 3.9% |
| Q2 2022 | 0.0% | 0.0% | 3.9% |
| Q3 2022 | 0.0% | 0.0% | 4.0% |
| Q4 2022 | 0.0% | 0.0% | 4.4% |
| Q1 2023 | 0.0% | 0.0% | 4.2% |
| Q2 2023 | 0.0% | 0.0% | 4.4% |
| Q3 2023 | 0.0% | 0.0% | 4.4% |
| Q4 2023 | 0.0% | 0.0% | 4.6% |
| Ashburton District | |||
| Quarter | 1 brm unit | 2 brm unit | 3 brm house |
| Q1 2022 | 0.0% | 0.0% | 4.7% |
| Q2 2022 | 0.0% | 0.0% | 5.0% |
| Q3 2022 | 0.0% | 0.0% | 5.3% |
| Q4 2022 | 0.0% | 0.0% | 4.8% |
| Q1 2023 | 0.0% | 0.0% | 5.0% |
| Q2 2023 | 0.0% | 6.1% | 5.3% |
| Q3 2023 | 0.0% | 7.2% | 5.8% |
| Q4 2023 | 0.0% | 0.0% | 6.1% |
| Timaru District | |||
| Quarter | 1 brm unit | 2 brm unit | 3 brm house |
| Q1 2022 | 0.0% | 6.4% | 5.1% |
| Q2 2022 | 0.0% | 6.3% | 4.8% |
| Q3 2022 | 0.0% | 5.3% | 5.2% |
| Q4 2022 | 0.0% | 6.1% | 5.6% |
| Q1 2023 | 0.0% | 6.6% | 5.4% |
| Q2 2023 | 0.0% | 6.7% | 5.2% |
| Q3 2023 | 0.0% | 5.4% | 5.4% |
| Q4 2023 | 0.0% | 5.6% | 5.8% |
| Queenstown-Lakes District | |||
| Quarter | 1 brm unit | 2 brm unit | 3 brm house |
| Q1 2022 | 4.4% | 4.1% | 3.2% |
| Q2 2022 | 4.8% | 4.8% | 3.3% |
| Q3 2022 | 7.4% | 4.3% | 3.6% |
| Q4 2022 | 4.8% | 4.7% | 3.8% |
| Q1 2023 | 8.8% | 5.0% | 3.9% |
| Q2 2023 | 5.2% | 5.5% | 4.1% |
| Q3 2023 | 9.1% | 6.1% | 3.9% |
| Q4 2023 | 21.5% | 5.9% | 4.0% |
| Dunedin City | |||
| Quarter | 1 brm unit | 2 brm unit | 3 brm house |
| Q1 2022 | 5.0% | 6.4% | 4.7% |
| Q2 2022 | 4.3% | 5.6% | 4.8% |
| Q3 2022 | 4.6% | 6.0% | 5.4% |
| Q4 2022 | 4.2% | 7.4% | 5.6% |
| Q1 2023 | 5.8% | 6.6% | 5.9% |
| Q2 2023 | 5.5% | 6.0% | 5.9% |
| Q3 2023 | 4.9% | 5.0% | 5.8% |
| Q4 2023 | 5.6% | 6.1% | 5.6% |
| Invercargill City | |||
| Quarter | 1 brm unit | 2 brm unit | 3 brm house |
| Q1 2022 | 8.8% | 6.1% | 5.9% |
| Q2 2022 | 11.9% | 7.0% | 6.1% |
| Q3 2022 | 8.7% | 6.8% | 6.0% |
| Q4 2022 | 0.0% | 7.3% | 6.0% |
| Q1 2023 | 0.0% | 6.4% | 6.8% |
| Q2 2023 | 0.0% | 6.2% | 6.5% |
| Q3 2023 | 9.7% | 7.4% | 6.5% |
| Q4 2023 | 0.0% | 6.7% | 6.9% |
| All of Aotearoa | |||
| Quarter | 1 brm unit | 2 brm unit | 3 brm house |
| Q1 2022 | 6.4% | 5.7% | 4.7% |
| Q2 2022 | 7.8% | 5.7% | 4.9% |
| Q3 2022 | 6.9% | 6.2% | 5.2% |
| Q4 2022 | 9.7% | 6.3% | 5.3% |
| Q1 2023 | 10.2% | 6.8% | 5.7% |
| Q2 2023 | 9.8% | 7.1% | 5.6% |
| Q3 2023 | 10.4% | 7.2% | 5.6% |
| Q4 2023 | 8.7% | 6.8% | 5.6% |
| Auckland Council Ward Areas: | |||
| See map below for ward boundaries | |||
| Auckland - Rodney Ward | |||
| Quarter | 1 brm unit | 2 brm unit | 3 brm house |
| Q1 2022 | 0.0% | 0.0% | 3.5% |
| Q2 2022 | 0.0% | 0.0% | 3.5% |
| Q3 2022 | 0.0% | 0.0% | 3.9% |
| Q4 2022 | 0.0% | 0.0% | 3.7% |
| Q1 2023 | 0.0% | 0.0% | 3.5% |
| Q2 2023 | 0.0% | 3.4% | 4.0% |
| Q3 2023 | 2.6% | 0.0% | 3.9% |
| Q4 2023 | 0.0% | 4.0% | 4.3% |
| Auckland - Albany Ward | |||
| Quarter | 1 brm unit | 2 brm unit | 3 brm house |
| Q1 2022 | 4.1% | 3.4% | 3.2% |
| Q2 2022 | 4.5% | 3.6% | 3.4% |
| Q3 2022 | 3.8% | 3.8% | 3.6% |
| Q4 2022 | 4.2% | 4.3% | 3.7% |
| Q1 2023 | 5.1% | 4.5% | 3.9% |
| Q2 2023 | 6.0% | 5.0% | 3.9% |
| Q3 2023 | 4.9% | 4.8% | 4.1% |
| Q4 2023 | 4.5% | 4.8% | 4.0% |
| Auckland - North Shore Ward | |||
| Quarter | 1 brm unit | 2 brm unit | 3 brm house |
| Q1 2022 | 3.9% | 3.5% | 3.1% |
| Q2 2022 | 4.2% | 3.9% | 3.3% |
| Q3 2022 | 4.6% | 4.1% | 3.4% |
| Q4 2022 | 4.2% | 4.1% | 3.5% |
| Q1 2023 | 6.0% | 4.1% | 3.7% |
| Q2 2023 | 5.2% | 4.6% | 3.9% |
| Q3 2023 | 4.7% | 5.0% | 3.9% |
| Q3 2023 | 5.2% | 4.5% | 3.9% |
| Auckland - Waitakere Ward | |||
| Quarter | 1 brm unit | 2 brm unit | 3 brm house |
| Q1 2022 | 16.7% | 3.4% | 3.3% |
| Q2 2022 | 5.1% | 3.6% | 3.6% |
| Q3 2022 | 0.0% | 4.8% | 3.7% |
| Q4 2022 | 0.0% | 4.1% | 3.8% |
| Q1 2023 | 3.5% | 4.7% | 4.0% |
| Q2 2023 | 0.0% | 5.3% | 4.4% |
| Q3 2023 | 0.0% | 5.1% | 4.2% |
| Q4 2023 | 0.0% | 5.0% | 4.2% |
| Auckland - Waitemata and Gulf Ward | |||
| Quarter | 1 brm unit | 2 brm unit | 3 brm house |
| Q1 2022 | 9.1% | 10.6% | 2.8% |
| Q2 2022 | 26.4% | 10.0% | 2.9% |
| Q3 2022 | 16.5% | 10.4% | 2.6% |
| Q4 2022 | 24.2% | 9.9% | 2.8% |
| Q1 2023 | 19.4% | 10.5% | 2.9% |
| Q2 2023 | 25.0% | 11.0% | 3.7% |
| Q3 2023 | 21.0% | 16.0% | 3.3% |
| Q4 2023 | 14.2% | 10.6% | 3.2% |
| Auckland - Whau Ward | |||
| Quarter | 1 brm unit | 2 brm unit | 3 brm house |
| Q1 2022 | 5.3% | 4.5% | 3.2% |
| Q2 2022 | 6.5% | 4.0% | 3.3% |
| Q3 2022 | 3.3% | 4.2% | 3.5% |
| Q4 2022 | 4.6% | 4.1% | 3.7% |
| Q1 2023 | 0.0% | 5.1% | 4.0% |
| Q2 2023 | 4.5% | 5.8% | 4.0% |
| Q3 2023 | 4.8% | 5.3% | 4.2% |
| Q4 2023 | 6.5% | 5.4% | 3.9% |
| Auckland - Albert-Eden-Puketapapa Ward | |||
| Quarter | 1 brm unit | 2 brm unit | 3 brm house |
| Q1 2022 | 4.2% | 4.0% | 2.9% |
| Q2 2022 | 4.2% | 3.9% | 3.1% |
| Q3 2022 | 4.9% | 4.1% | 3.2% |
| Q4 2022 | 4.7% | 4.5% | 3.1% |
| Q1 2023 | 5.0% | 4.9% | 3.4% |
| Q2 2023 | 4.9% | 4.8% | 3.9% |
| Q3 2023 | 5.7% | 5.2% | 3.7% |
| Q4 2023 | 6.2% | 4.9% | 3.7% |
| Auckland - Orakei Ward | |||
| Quarter | 1 brm unit | 2 brm unit | 3 brm house |
| Q1 2022 | 5.3% | 3.4% | 2.5% |
| Q2 2022 | 4.5% | 3.5% | 2.8% |
| Q3 2022 | 6.7% | 3.6% | 2.7% |
| Q4 2022 | 6.4% | 3.8% | 3.1% |
| Q1 2023 | 7.8% | 4.4% | 3.3% |
| Q2 2023 | 5.2% | 4.0% | 3.3% |
| Q3 2023 | 6.8% | 4.6% | 3.5% |
| Q4 2023 | 6.2% | 4.5% | 3.1% |
| Auckland - Maungakiekie-Tamaki Ward | |||
| Quarter | 1 brm unit | 2 brm unit | 3 brm house |
| Q1 2022 | 4.1% | 5.0% | 2.9% |
| Q2 2022 | 5.2% | 4.3% | 3.3% |
| Q3 2022 | 5.5% | 3.1% | 2.3% |
| Q4 2022 | 5.5% | 4.4% | 3.6% |
| Q1 2023 | 8.4% | 4.7% | 3.8% |
| Q2 2023 | 11.0% | 4.8% | 4.0% |
| Q3 2023 | 5.4% | 5.6% | 3.9% |
| Q4 2023 | 5.8% | 5.4% | 3.8% |
| Auckland - Howick Ward | |||
| Quarter | 1 brm unit | 2 brm unit | 3 brm house |
| Q1 2022 | 4.6% | 4.0% | 3.0% |
| Q2 2022 | 0.0% | 3.9% | 3.4% |
| Q3 2022 | 5.3% | 4.6% | 3.2% |
| Q4 2022 | 5.1% | 4.0% | 3.4% |
| Q1 2023 | 5.0% | 4.4% | 3.5% |
| Q2 2023 | 5.6% | 4.8% | 3.6% |
| Q3 2023 | 4.9% | 5.0% | 3.7% |
| Q4 2023 | 0.0% | 4.8% | 3.6% |
| Auckland - Manukau Ward | |||
| Quarter | 1 brm unit | 2 brm unit | 3 brm house |
| Q1 2022 | 5.1% | 4.1% | 3.8% |
| Q2 2022 | 5.5% | 4.3% | 4.0% |
| Q3 2022 | 5.4% | 5.1% | 4.3% |
| Q4 2022 | 5.5% | 4.7% | 4.5% |
| Q1 2023 | 6.0% | 5.0% | 4.6% |
| Q2 2023 | 6.9% | 5.8% | 4.8% |
| Q3 2023 | 6.1% | 5.8% | 4.7% |
| Q4 2023 | 0.0% | 4.5% | 4.9% |
| Auckland-Manurewa-Papakura Ward | |||
| Quarter | 1 brm unit | 2 brm unit | 3 brm house |
| Q1 2022 | 0.0% | 3.9% | 3.8% |
| Q2 2022 | 0.0% | 4.2% | 4.1% |
| Q3 2022 | 0.0% | 4.2% | 4.2% |
| Q4 2022 | 0.0% | 4.8% | 4.5% |
| Q1 2023 | 0.0% | 4.9% | 4.8% |
| Q2 2023 | 0.0% | 5.4% | 4.6% |
| Q3 2023 | 0.0% | 5.2% | 4.8% |
| Q4 2023 | 4.9% | 5.6% | 4.8% |
| Auckland - Franklin Ward | |||
| Quarter | 1 brm unit | 2 brm unit | 3 brm house |
| Q1 2022 | 4.3% | 3.5% | 3.8% |
| Q2 2022 | 0.0% | 0.0% | 3.7% |
| Q3 2022 | 0.0% | 4.1% | 4.0% |
| Q4 2022 | 0.0% | 0.0% | 4.1% |
| Q1 2023 | 0.0% | 0.0% | 4.3% |
| Q2 2023 | 0.0% | 0.0% | 4.4% |
| Q3 2023 | 0.0% | 5.7% | 4.3% |
| Q4 2023 | 4.3% | 5.7% | 4.5% |
| Notes: Indicative yield figures are based on the Real Estate Institute of NZ's lower quartile selling price for each type of property, in each district, for each quarter. Rents are based on bonds received by Tenancy Services for each type of property in each district. Units include all multi-unit properties such as apartments and home units. Where too few properties were sold or rented in a quarter to produce a reliable figure, the yield is shown as 0.0%. | |||
•You can have articles like this delivered directly to your inbox via our free Property Newsletter. We send it out 3-5 times a week with all of our property-related news, including auction results, interest rate movements and market commentary and analysis. To start receiving them, register here (it's free) and when approved you can select any of our free email newsletters.
We welcome your comments below. If you are not already registered, please register to comment
Remember we welcome robust, respectful and insightful debate. We don't welcome abusive or defamatory comments and will de-register those repeatedly making such comments. Our current comment policy is here.