
House prices and sales numbers both declined in April, pushed lower by what the Real Estate Institute of NZ described as an "autumn chill."
The REINZ recorded 6427 residential sales throughout the country in April. That's down from 7797 in March (-17.6%), but up 9.5% compared to April last year.
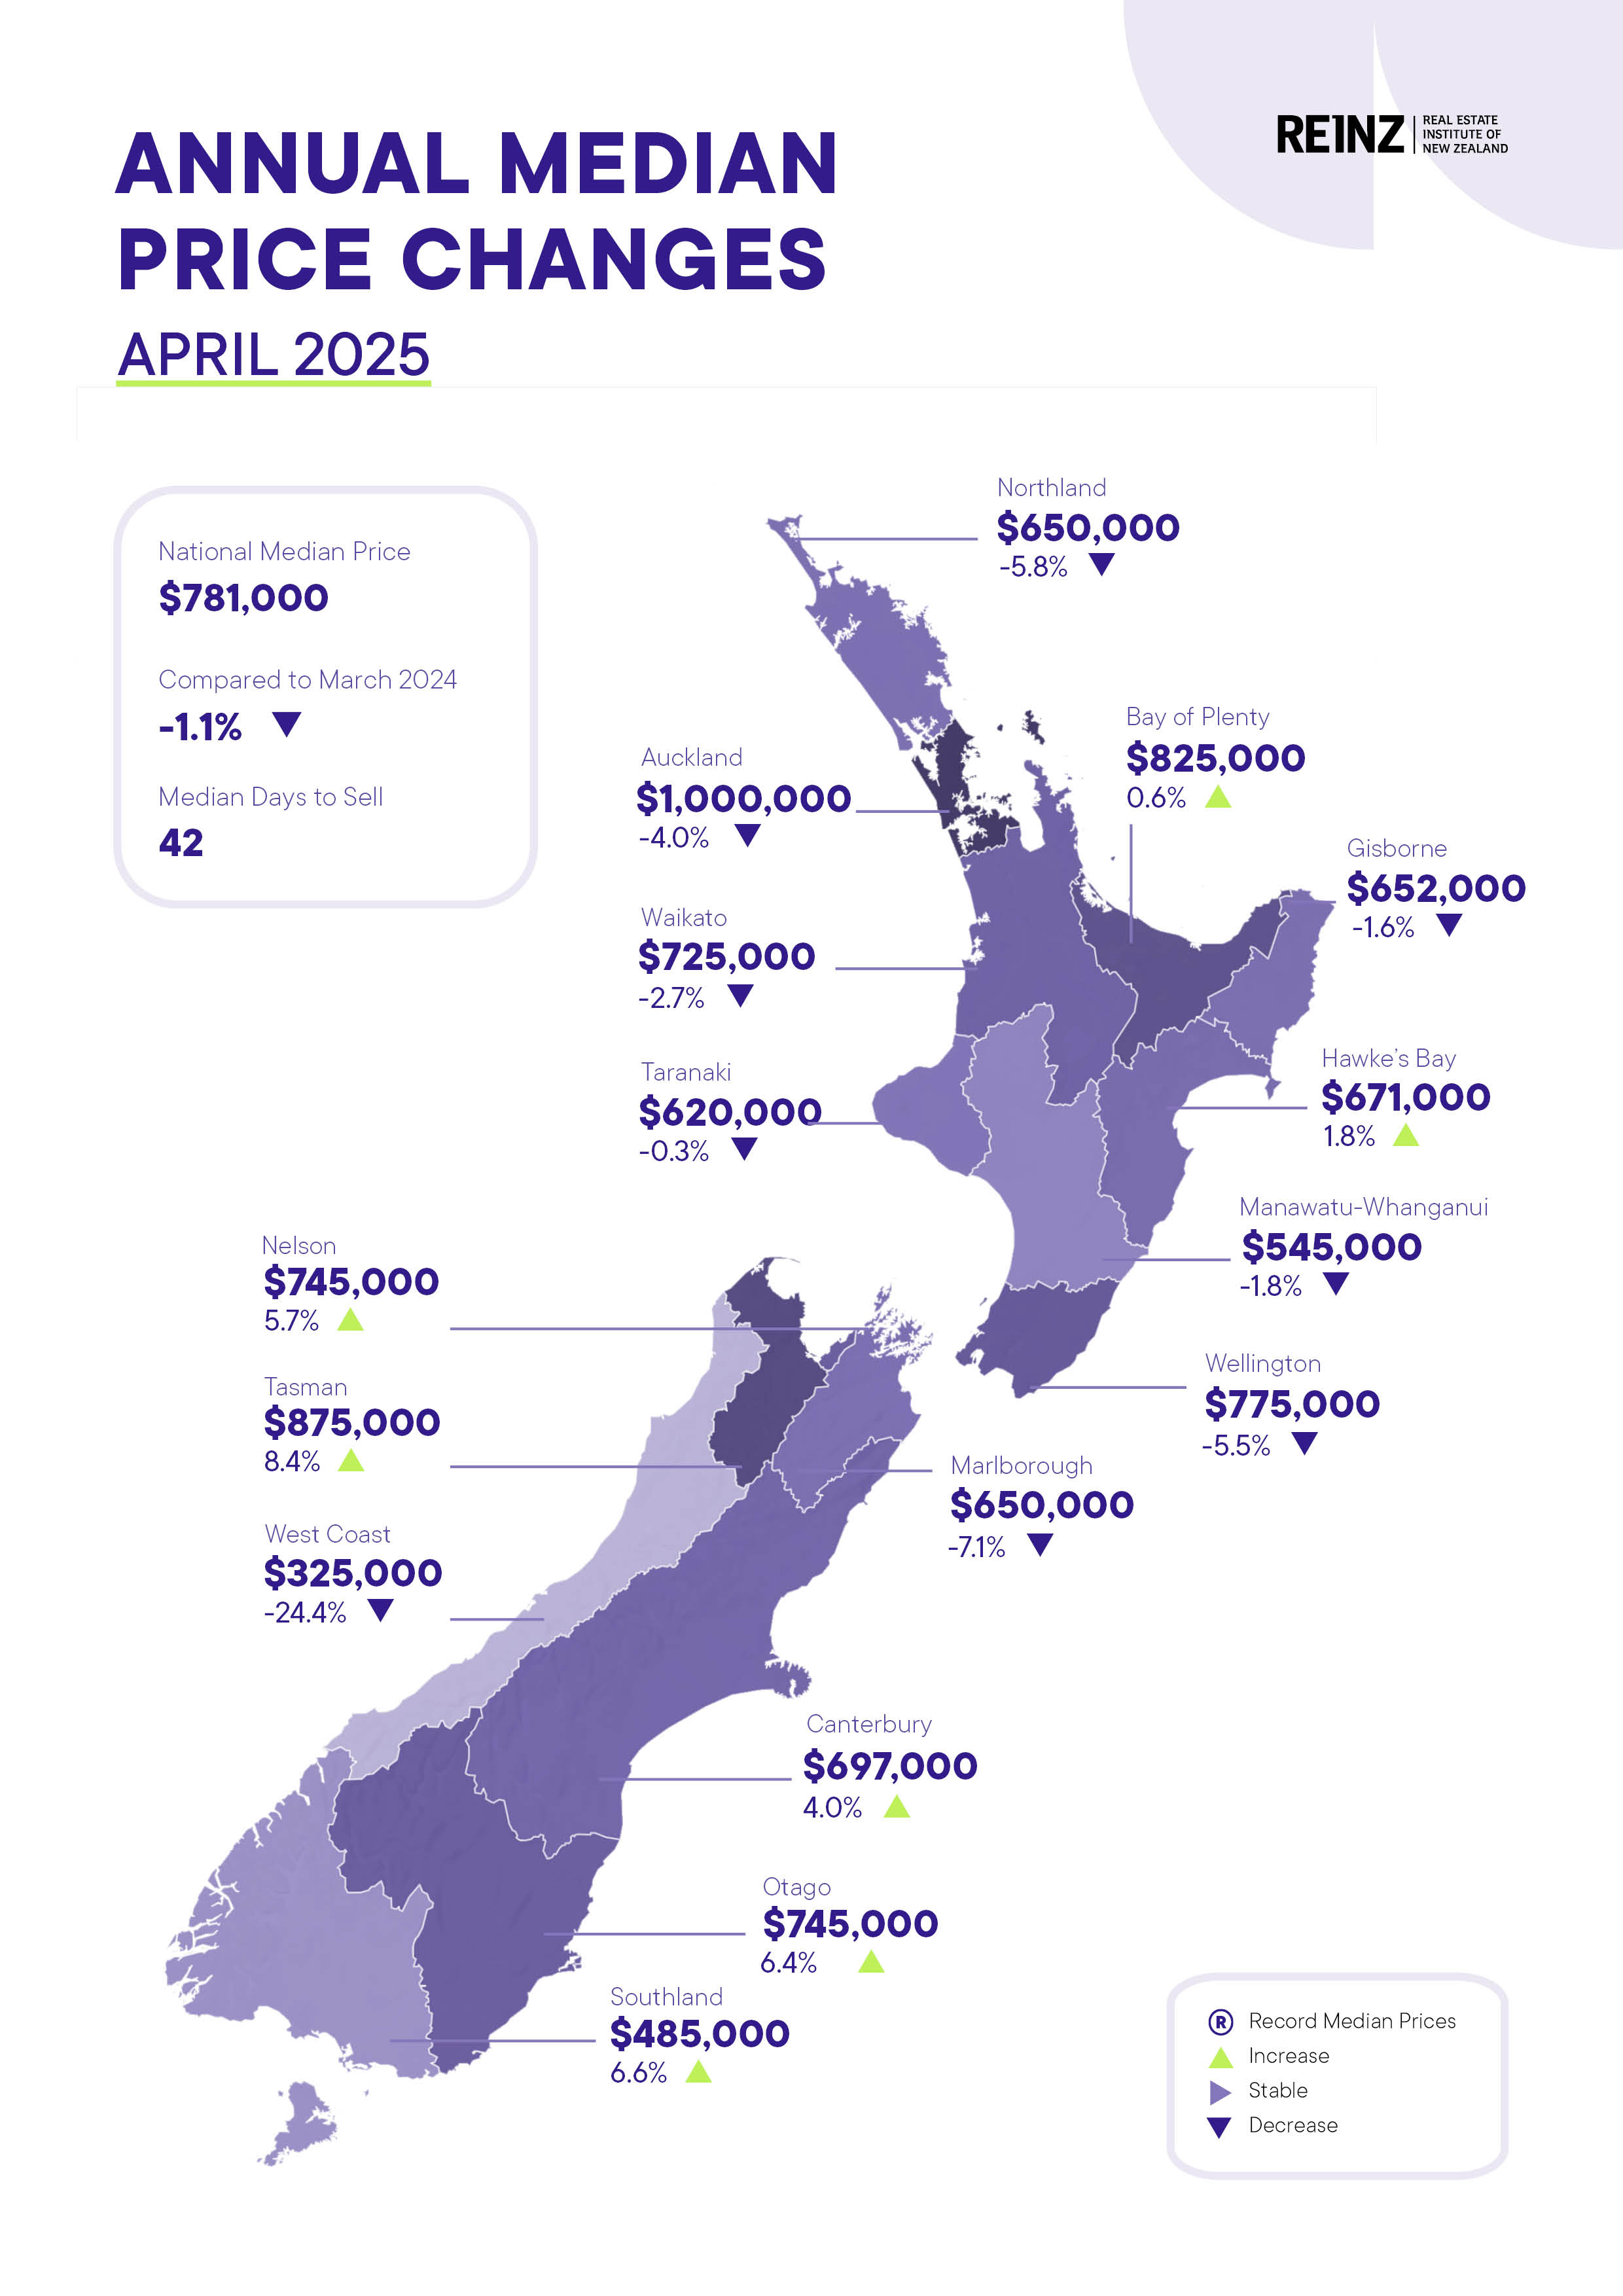
The median selling price in April was $781,000, down by $9000 (-1.1%) compared to both March this year and April last year.
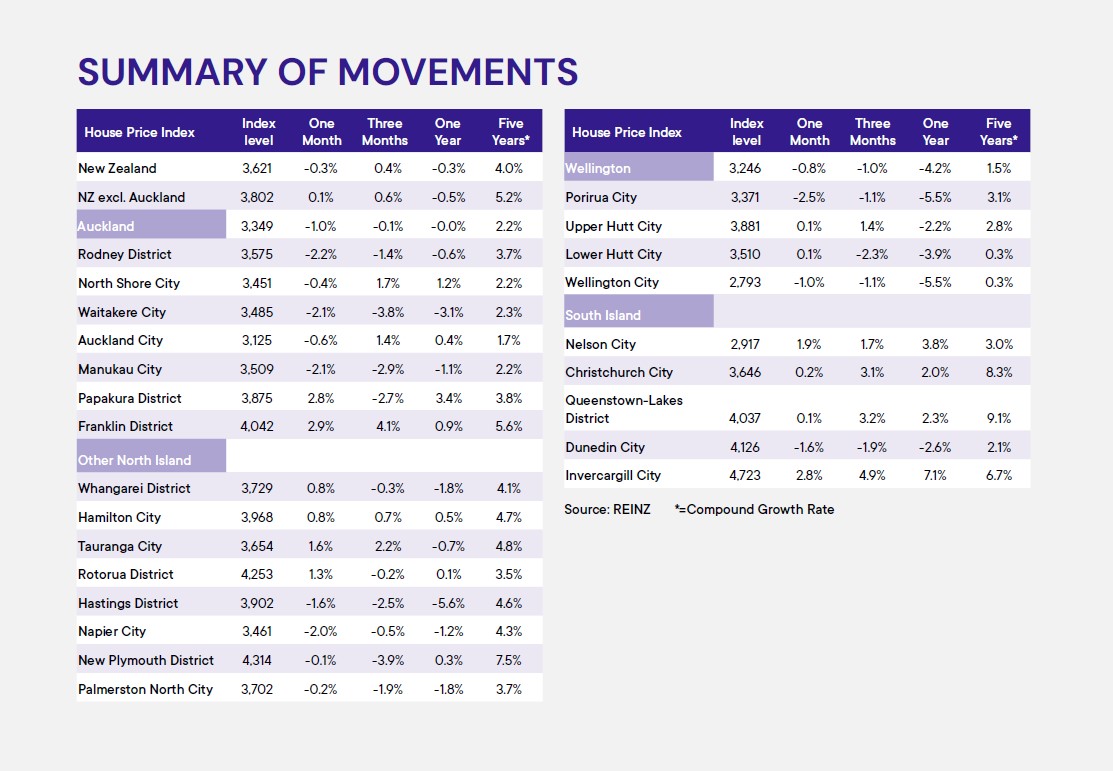
Perhaps more importantly, the REINZ House Price Index, which adjusts for differences in the mix of properties sold each month, declined by 0.3% compared to both March this year and April last year.
The biggest monthly decline of -2.5% was in Porirua, followed by Rodney in Auckland -2.2%, then Waitakere and Manukau, both in Auckland and both on - 2.1%, then Napier -2.0%. See the table below for the full regional results.
"There has been a notable increase in sales across the country [compared to a year ago], however despite this upward trend, property prices continue to decline due to a significant number of properties still available on the market," REINZ Acting Chief Executive Rowan Dixon said.
"Real estate professionals report that buyers are seeking properties at lower price points and they are willing to explore alternative options if they view prices as being excessively high," he said.
The comment stream on this story is now closed.
Median price - REINZ
Select chart tabs
Volumes sold - REINZ
Select chart tabs

43 Comments
The Most epic housing crash in all of NZs recent history, continues to roll down the slippery slope of losses.
Bottom perhaps to be seen in 2027 or 2028?
Buyers should offer no more the 2015 prices. Otherwise, negative equity comes a knocking in year or two.
Yep, the "most epic house crash in all of New Zealands history" is down 0.3% (HPI) in the last 12 months!
Edit: the HPI is also up 4.0% compound over the last 5 years (= 21.7% up in 5 years)
.
Looks about right. The chart is median price which is pretty noisy month-to-month.
Apr25 median price 781000, Apr20 680000, gain of 15%
Compare to May20, median price 620000, gain of 26%.
Note the * next to the 5-year data, this column is an annual compound growth rate. The 5 year data still catches most of the Covid run up in prices which hasn't been fully undone. Give it another year and the 5-yearly CAGR will be very low, maybe even negative.
Yeah I got that wrong!
So, are you surprised that house prices today are over 20% higher than 5 years ago ?
Spacecadet only works with theoretical maths, not real world stuff.
That was all to do with what was happening 4-5 years ago, little to do with what’s happening now. You’ll only be able to say that for a few more months…5 yr CAGR will drop very fast over next 12-18 months.
Leaning on the 5yr compounded average shows financial illiteracy.
It obviously includes the 2021-2022 covid era distortion from record low interest rates, fiscal helicopter money and FOMO mania.
Nice denial juice.
That's why I mentioned the more common 12 months measure first: "most epic house crash in all of New Zealands history" is down 0.3% (HPI) in the last 12 months! Truely catastrophic, isn't it Time Lord ?
If you don't like the 5 year comparison, please tell Greg directly that he is "financially illiterate" since he's the one who published the figure.
Exactly, your comment contradicts itself. You admit prices are down over the last 12 months but you still turn to the distorted 5 year compounded rate for comfort.
It is YOU who chose to make it your focus. Greg mentions nothing about the 5yr compounding rate. It’s clearly the chart from the REINZ release (but you already know this).
House price corrections don’t play out in a straight line, they play out over years, sometimes decades. Where did Gecko say NZ's epic house price crash started and ended in the last 12 months?
Wow, having a bad day ? There is no contradiction at all, just facts (google the word). The HPI was down a minuscule 0.3% over one year and up 4% compound over 5 years (= up over 21%). Both metrics do not align with Gecko's claim of "The Most epic housing crash in all of NZs history continues to roll down the slippery slope of losses". These are two common metrics, too bad if you don't like them because you're cheering on the "house crash".
Take a look at whats happened in the last 5 years on this chart
Now slide the time scale back as far as it goes... tell us what you see
OK, I'll help you out since you seem too lazy to Google it yourself.
Fact: a thing that is known or proved to be true. "he ignores some historical and economic facts"
HPI down 0.3% over the last year is a fact.
HPI up a compound 4% over the last 5 years (= up over 21%) is a fact.
Gecko's comment: "The Most epic housing crash in all of NZs history continues to roll down the slippery slope of losses" is a wild, emotional, exaggerated opinion, not supported by facts.
I hope you get it now.
Leaning on the 5yr compounded average shows financial illiteracy. fact
At last, some house price banter. The comments section has been drier than a buzzards crutch.
Use whatever metric you desire, it is not an epic house price crash - not remotely close to one. There is an enormous distortion around 2020/21 that is still unwinding. We also need to factor in the huge supply of infill houses and various zoning changes and the impact they have on prices.
Amen to that (the dry comments section).
Agreed, let’s pour one out for the comments section tonight. RIP
Calling it a distortion is subjective. Nominal house prices are back to Feb 2021 levels. When you actually look at the chart, ‘distortion’ isn’t the first word that comes to mind.
Can house prices hold the line at the seventh labelled market bottom ...through winter?
"Leaning on the 5yr compounded average shows financial illiteracy. fact"
Good on you for trying TL. This is not quite a fact because it's not measurable, it's your opinion, which is subjective.
I'll give you another example of a fact to help you understand.
Over 90% of houses are sold at a profit as per today's Interest article. See TL, this is a fact as it is measurable and therefore irrefutable. (Well to most reasonable minds anyway
9% sold for a loss and "it's a proportion that keeps on rising"... Winter is coming and the number of houses for sale keeps on rising too. They're facts. In my opinion some people who want to sell won't as they won't want to crystallize their loss, they'll be hanging in there. I dont think a couple of 0.25% reductions in our OCR is going to stop the rot for quite a while.
Yes, the 9% of houses sold at a loss is indeed fact. Also as you correctly said; "In my opinion….. about what may happen in the future", is indeed… opinion.
And selling at a loss is not really a problem for many if all they are doing is moving house or moving cities. Would selling an Auckland house bought in 2020 to buy a new house in Wellington really be a loss? Only if you had very little equity. What would be interesting would be the statistic that showed the percentage of house sales where sellers were left with no or negative equity.
It could be a problem for first home buyers. They could loose their deposit, Kiwisaver probably used to create the deposit. All gone. Back to renting or moving back with the parents. As with others, no one likes to take a loss, most will avoid it if they can, 9%, and climbing, obviously couldn't...
It would be unreasonable to cry over a loss while buying the next house for significantly less than it would have got in 2020.
Unless that to, is a declining position.
😂 what’s behind that 5yr compound rate Yves? You didn’t look at the chart, did you..
That figure isn't magic. It's built on data. It can be viewed. It can be measured. You can clearly see whether the trend is your friend or not.
Clearly the current 5yr compound average is heavily distorted. Only the financially illiterate would fail to see that.
Did we fall through another bottom last month?
Ok, I accept, at this stage, it is the second most epic property crash in NZ history.....only eclipsed by the crash ending in 1980.
So the biggest crash in 45 years.......and counting:
Real Residential Property Prices for New Zealand (QNZR628BIS) | FRED | St. Louis Fed
The final chapter, of the bottom of this crash, will be told in 2027. Buyers Beware!
What it tells us...
The time scale shows the impact three key historical events. 1) impact of more mum's/partners in the workforce (more house hold income), so no more big increase to be had there without polygamy. 2) Shows the impact of central bank currency debasement -printing like a madman -probably more of this to come, and 3) shows the impact of low interest rates to keep the asset ponzi afloat. Which also remains very low today by the standards of the same time period. Add in a tax environment where there is not tax restraining asset inflation not supported by income and vola....here we are.
Even the immigrant's are voting with their feet along with our educated youth. All big negatives for a tax base based on people staying and working. Perhaps we just need an alternative tax base.
Perhaps we just need an alternative tax base.
Tariffs perhaps?... it is a beautiful word.
Or land tax.
Lol classic aye Yvil...
Surely not a surprise under those headwinds of Govt lolly scramble stopped, cost of debt back to lower normal, recessionary market, trade war, shooting war hot spots and orange rain falling left and right in the largest global economy.
The effects of several of those issues have yet to hit us, or at least recorded data
Global bonds all on the rise again.........
- USA 10yr over 4.5%, 30yr nearly 5%.
NZ 10yr near 4.7%..........
Mortgage rates near the lows now at only 5% ...... and rises are on the horizon.
Specuvestors are in trouble, more so come 2026/2027. They need the 2.99% mortgages now, to see any chances of capital gains.
SpeccyNiftYvls squirming?
From 1974-80 house prices fell 40% in real terms here
While todays inflation is nothing like back then, housing performance certainly is. It's clear some are so besotted they're yet to realize their losses. For the wannabe flipper, I think the true cost of debt is horrendous and financially self defeating in times such as these. The more time that passes the more this appears to be a new normal.
"SpeccyNiftYvls squirming?"
Yes NZG, I'm just back from "squirming" in Bali with 20 friends to celebrate my birthday. I'm going to Shanghai, Venice, Switzerland, France and Spain for 5 1/2 weeks over June & July. You would not want to be in my shoes, all that terrible squirming overseas.
How can this be? We had two consecutive months of gains. The RE and banking pundits promised me a boom.
The vested...the most truthful. I guess it was a great decade or two when there was always another sucker.
🍿
I hate it when you have been chatting up someone at a bar for an hour so and you suddenly realize that they are
willing to explore alternative options
Real Estate agents must hate it as well.
No one likes a house sale tease
So
In the Summary of Movements it shows Auckland flat ie 0 over one year but on the infograhic it shows -4%
Summary of Movements is the HPI prices
Infographic is the Median prices
cheers for that , wow the mediums are well out of sync with the HPI then for AKL.
I am going to guess its falling townhouses but when I look at the auction results for Glendowie, my old stomping ground, I see decent 2mil stuff well below the peak, way more then the mentioned 16%, stuff is selling 16% under cv where it would easy get 16% over cv at peak
We welcome your comments below. If you are not already registered, please register to comment
Remember we welcome robust, respectful and insightful debate. We don't welcome abusive or defamatory comments and will de-register those repeatedly making such comments. Our current comment policy is here.