Housing economist Wasay Majid has been researching this country's much touted housing shortage and has come to a surprising conclusion - there is no shortage.
He says most estimates of the shortage rest on an assumption of how much housing stock needs to be rebuilt each year to maintain long term supply.
However his research suggests that number could be considerably exaggerated and as a result, the housing shortage may be nothing more than an urban myth.
Majid details his research on the so-called housing shortage in the report below:
The Great NZ housing shortage myth: How a theory inflated our crisis
By Wasay Majid
Open any report on New Zealand’s housing crisis and you will see the same claim: we have a housing shortage. Banks repeat it and ministers cite it to justify “building our way out.”
But what if that shortage is not real and simply the product of faulty assumptions?
The issue is not supply. It is a technical concept known as the replacement rate (RR), or demolition rate, or depreciation rate (each bank uses a separate word for this - see below) which has quietly distorted our understanding of housing need.
This framing has a massive impact. It inflates demand figures and creates a large shortfall on paper. When tested against real numbers, the story changes completely.
What Is the Replacement/Demolition Rate?
The replacement rate is a theoretical estimate of how much housing stock needs to be rebuilt each year to maintain long-term supply.
Therefore, it does not reflect the functional housing stock or the level of housing services that stock provides. It is a long-term planning tool. So the entire shortage narrative rests on an assumption, one that has no recent verification.
Data on Demolitions Does Not Exist - So How Are We Modelling a Housing Shortfall?
Historically, Statistics NZ collected annual demolition data from 1969 to 1986 (see Dr. Johnstone, University of Auckland, p. 3) but discontinued it nearly four decades ago. In its absence, experts default to legacy estimates of demolition rates (not counts): Susan Brown’s residual-method figure of 0.6% (1975–1981) and David Burtt’s 0.4% (1979–1989), both from the National Housing Commission.
The 0.4% rate has since become the go-to assumption. This hypothetical replacement or demolition rate drives analysis across major institutions. Banks like ANZ (May 2021 Property Focus, p. 7) calculate a 70,000-home shortfall since 2006, factoring in “the rate at which the existing housing stock depreciates.”
Westpac’s March 2024 Economic Bulletin projects a need for 125,000 homes over five years to match population growth, but lifts that figure to around 150,000 once replacements from demolitions are factored in.
A Reserve Bank (RBNZ) report estimates “background” replacement at 11,000-13,000 dwellings yearly, nearly double what a 0.4% rate would imply at the 2001 housing stock level, while conflating developer knockdowns for densification with stock mortality, inflating perceived losses.
New Zealand Institute of Economic Research (NZIER) 2023 report, Assessing Housing Shortages in New Zealand, applies the same 0.4% depreciation rate.
Government echoes this: a Cabinet memo, Fixing the Housing Crisis, insists on boosting supply to fix the housing issue.
Many models assume only 93% of consents are completed, whereas, for example, if 98% of consents became completions the supply would be even higher by 5%.
By comparison, Harvard’s Joint Centre for Housing Studies reports U.S. rates of 0.22% -0.28% recently, while a UK study cites theirs at 0.1% (1986–1990).
New Zealand’s 0.4% is twice the U.S. average and four times the UK, yet it shapes policy without empirical backing.
Here is the problem! These ‘demolitions’ are hypothetical, treated as vanished homes and framed as new (replacement) demand adding pressure on the housing system.
Because the replacement rate is a percentage of total stock, high construction years can produce higher modelled demolitions, even if actual knockdowns do not rise.
This circular logic can turn real net gains into paper shortages. With today’s shortage claims built on these legacy rates, not current demolition data, the result is a modelling fiction sold as fact. I believe, this demands scrutiny before shaping policy.
What the Data Actually Shows (Fig. 1)
To test the theory, I built three housing supply-demand mismatch models covering 2001 to 2024. The first uses census data where ‘actual’ dwelling counts are housing supply and population totals as demand, assuming 2.7 people per household. This shows a surplus of 35,389 homes.
The second mirrors the method used by banks and policy advisors. It uses the ‘hypothesised’ replacement rate of 0.4% for demolitions, new completed consents (93% of consents) as supply, and population-based demand where household size is 2.7.
This model shows a growing shortage since 2001, peaking at 121,000 homes in 2020 before dropping to 73,623 in 2024.
The third uses an ‘estimated’ RR of 0.1%, based on the residual method which uses consent completions and census dwelling growth. Plug that in, and the model shows a surplus of nearly 49,000 homes.
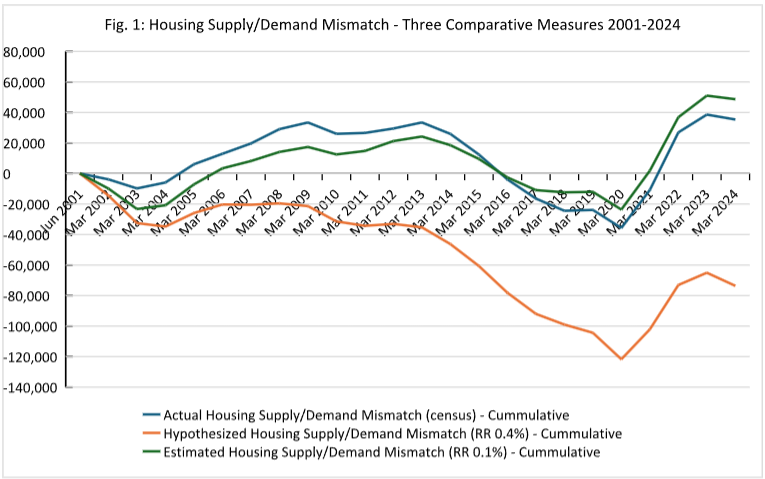
One assumption flips the narrative.
The 0.4% rate shows a crisis. The 0.1% rate shows a surplus. Even basic mathematics breaks the myth. We built 601,000 new homes between 2001 and 2024 which is enough to house 1.6 million people.
Our population grew by only 1.4 million over this period.
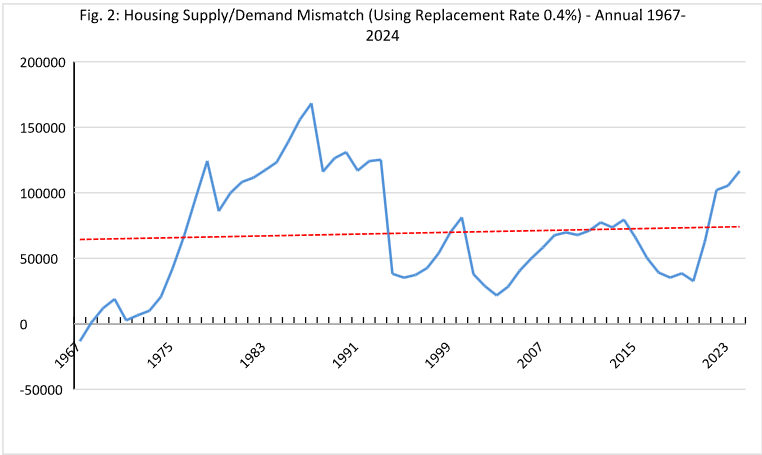
The Long View That Changes Everything (Fig. 2)
If supply has consistently fallen short, the shortage should compound over time. So I extended the model back to 1967, using the same 0.4% demolition rate.
The result? No long-run shortage. Despite a deficit of around 13,000 homes at the base year, supply caught up.
By 2024, there was a surplus of over 116,500.
This figure is based on 93% of consents becoming completions. If completions were a 100% the surplus would be
around 40,000 additional homes making a total of around 156,000 surplus homes.
This is the same assumption (RR of 0.4%) used to justify the present crisis claims. Over a longer period, it proves the opposite. So why start from 2001 or 2006? Because those dates support the crisis narrative.
A Closer Look at Demolitions – inflated numbers
From 2001 to 2024, the 0.4% rate implies 163,000 homes were demolished, but the estimated figure is closer to 41,000 demolitions.
That is a fourfold difference. Even when using census data, the total estimated demolitions sit at around 54,000, suggesting the hypothesised 0.4% rate overstates demolitions by at least three times.
Under the census figures, about 9% of all new builds (i.e., 601,000) replaced old ones. The 0.4% model claims this to be around 30%, nearly a third of new builds replaced older demolished homes.
In theory, this can be argued as the bases of a healthy stock. In reality, it does not reflect our housing supply.
Why Replacement Rate Theory Fails to Explain Actual Housing Shortages
Replacement rate theory parallels demographic fertility rate theory, which maintains population stability by replacing those who leave. But unlike people, housing stock does not ‘die’ on a fixed schedule, some homes last centuries, other decades.
The theory focuses on housing lost to aging, depreciation, or obsolescence, implying new construction must match this ‘loss’.
Yet many older homes remain functional and occupied, especially where affordability pushes buyers and renters toward them.
Replacement does not equal a net loss in housing supply. By fixating on physical ‘mortality’, replacement rate theory overlooks the ongoing usability of older housing in meeting demand.
Who Benefits From the Shortage Myth?
This story is not accidental; it protects powerful interests.
Politicians promise ‘record-breaking builds’ while dodging real reforms like vacancy taxes or zoning changes. Banks and developers use the fear of scarcity to push higher prices and bigger mortgages.
Meanwhile, key problems like speculation, empty investment homes, easy credit, and inefficient land use get ignored.
A Better Way Forward
The idea we are tens of thousands short drives council plans and billion-dollar social housing programs. But if the shortage is exaggerated, policy is built on fiction.
Counting demolitions as new demand skews everything. It fuels overbuilding in the wrong places and homes no one can afford. More homes alone will not solve this.
We must tackle speculation, credit policies, and tax breaks that reward investors. Until then, supply will never meet affordability.
We need smarter policies.
We should track demolitions again (why did Stats NZ stop in 1986?), tax empty homes (Vancouver cut theirs by 25% with a simple levy), and deal with artificial scarcity via upzoning, ditch urban boundaries, and let builders build where demand exists.
The shortage myth is busted. The crisis depends on how you count and what you assume. It is not a shortage; it is a misdiagnosis.
It is time for a reset in how we frame, fund, and fix housing here in New Zealand.
The comment stream on this article is now closed.
Correction: References to the Infrastructure Commission in an earlier version of this report have been removed. The description of Wasay Majid's PHD qualification has been amended.
Wasay Majid holds a PhD in Property from the University of Auckland. He specialises in housing markets, affordability and the intersection between housing and monetary policy.

10 Comments
This!
Hey Pigeons meet my friend Cat
Fear however the 'narrative' is too deeply entrenched
Ironic that banks double or even treble the depreciation when looking at replacement rate but lend on a market that considers houses never depreciate they in fact appreciate at a fantastic rate.
Really worthwhile research.
And the downsides of these false assumptions/metrics currently used are enormous: higher rents, higher prices and higher borrowing.
Bravo on work, based in the best available data, that outlines and enumerates realities that have been too long ignored.
New research shows residential housing is still overpriced. Report by nh.
This story is not accidental; it protects powerful interests.
Politicians promise ‘record-breaking builds’ while dodging real reforms like vacancy taxes or zoning changes. Banks and developers use the fear of scarcity to push higher prices and bigger mortgages.
Indeed, and as so much of our economy relies on never ending credit expansion (enter 1990 to 2021) we are not set up on a macro level to do much else than export goods and services, mainly logs, meat and dairy.
Humans need options and/or pressure to make change, therefore we need structural change, accompanied with a push for entrepreneurialism and creativity plus more R&D to support new products, new ideas, and slowly (seems to be the case currently) teach the public that housing cannot go up forever and be relied on to make fortunes. More media coverage of new ideas and success stories to build confidence in having a go of it vs the property companies paying vast sums to media for coverage.
The qualm currently being that the govt says one thing, then takes action to support the status quo (reinstating interest deductability for landlords, tax breaks, fast track legislation to help mates).
There is a raft of errors in this analysis. Predominantly that the analysis is including demolitions. The reserve Bank analysis spoke of - is far simplier - it looks at each region and considers the growth in population. It does not consider demolitions.
Issues include:
- the housing supply is based on building consents not completions
- it doesn't allow for the change in households configuration - so an aging (but same size) population needs more houses to allow for more singles and couples and less family groups
- the additional supply has often been 2-bed townhouses - so the supply of housing may not cater for the 'average' household of 2.9 persons
All of these factors build on supply being overstated.
Does a 0.4% replacement rate imply the average NZ dwelling is built to last 250 years?
We welcome your comments below. If you are not already registered, please register to comment
Remember we welcome robust, respectful and insightful debate. We don't welcome abusive or defamatory comments and will de-register those repeatedly making such comments. Our current comment policy is here.