
A significant shift in the balance of supply and demand for residential properties across most of the country has contributed to the recent easing in house prices, according to property data company Cotality.
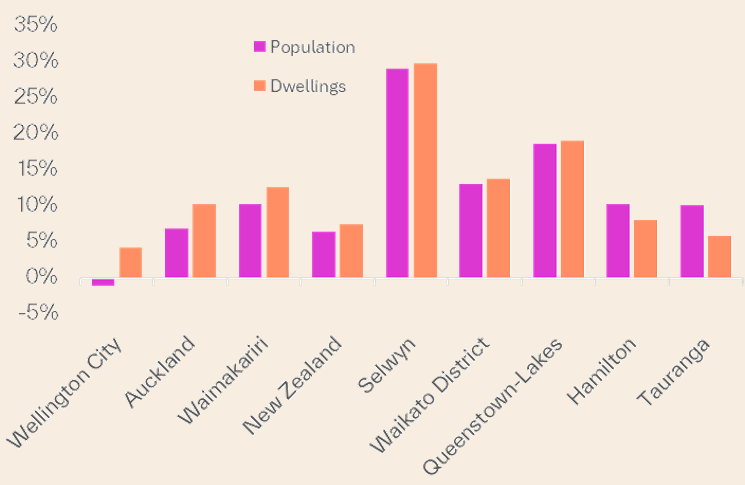
In Cotality's latest NZ Property Pulse report, the company's Chief Property Economist Kelvin Davidson said Auckland and Wellington were the main areas where property supply had outpaced population growth between 2019 and 2024.
"In Wellington, the population actually saw a small decline of 1.0% in the five years to 2024, while the dwelling stock increased by 4.3% - this caused the occupancy rate to drop from 2.97 [residents per dwelling] to 2.82," the report said.
While the recent property value downturn is partly an unwinding of previous affordability stress, this loosening of the supply and demand balance also played a role," it said.
A similar situation existed in Auckland.
"Auckland's population grew by a robust 7.0% over the same period, but this was exceeded by an even stronger 10.3% increase in dwelling stock - this eased Auckland's occupancy rate from 3.45 to 3.34, " the report said.
"This easing in the physical supply and demand balance aligns with the weakness in Auckland's property values, although it is also worth noting that the recent construction mix in Auckland has been dominated by townhouses, which are smaller and have a naturally lower occupancy rate," it said.
Other areas where the supply of housing outpaced population growth were Waimakariri and Selwyn in Canterbury and Queenstown-Lakes.
Going against the trend, population growth outstripped housing supply in Hamilton and Tauranga.
"Hamilton's population increased by 10.3%, while its dwellings grew by 8.1% and Tauranga saw population growth of 10.2% compared to a 5.9% rise in dwellings.
"Although these areas are not experiencing a property value boom, their markets have been more resilient than those in Auckland and Wellington, with less improvement in housing affordability," the report said.
The comment stream on this article is now closed.
Percentage Change in Population and Dwellings in Key Urban Areas 2019-2014

We welcome your comments below. If you are not already registered, please register to comment
Remember we welcome robust, respectful and insightful debate. We don't welcome abusive or defamatory comments and will de-register those repeatedly making such comments. Our current comment policy is here.