

The housing market was basically flat in February, with overall sales volumes and selling prices almost unchanged from a year ago and properties taking a little longer to sell.
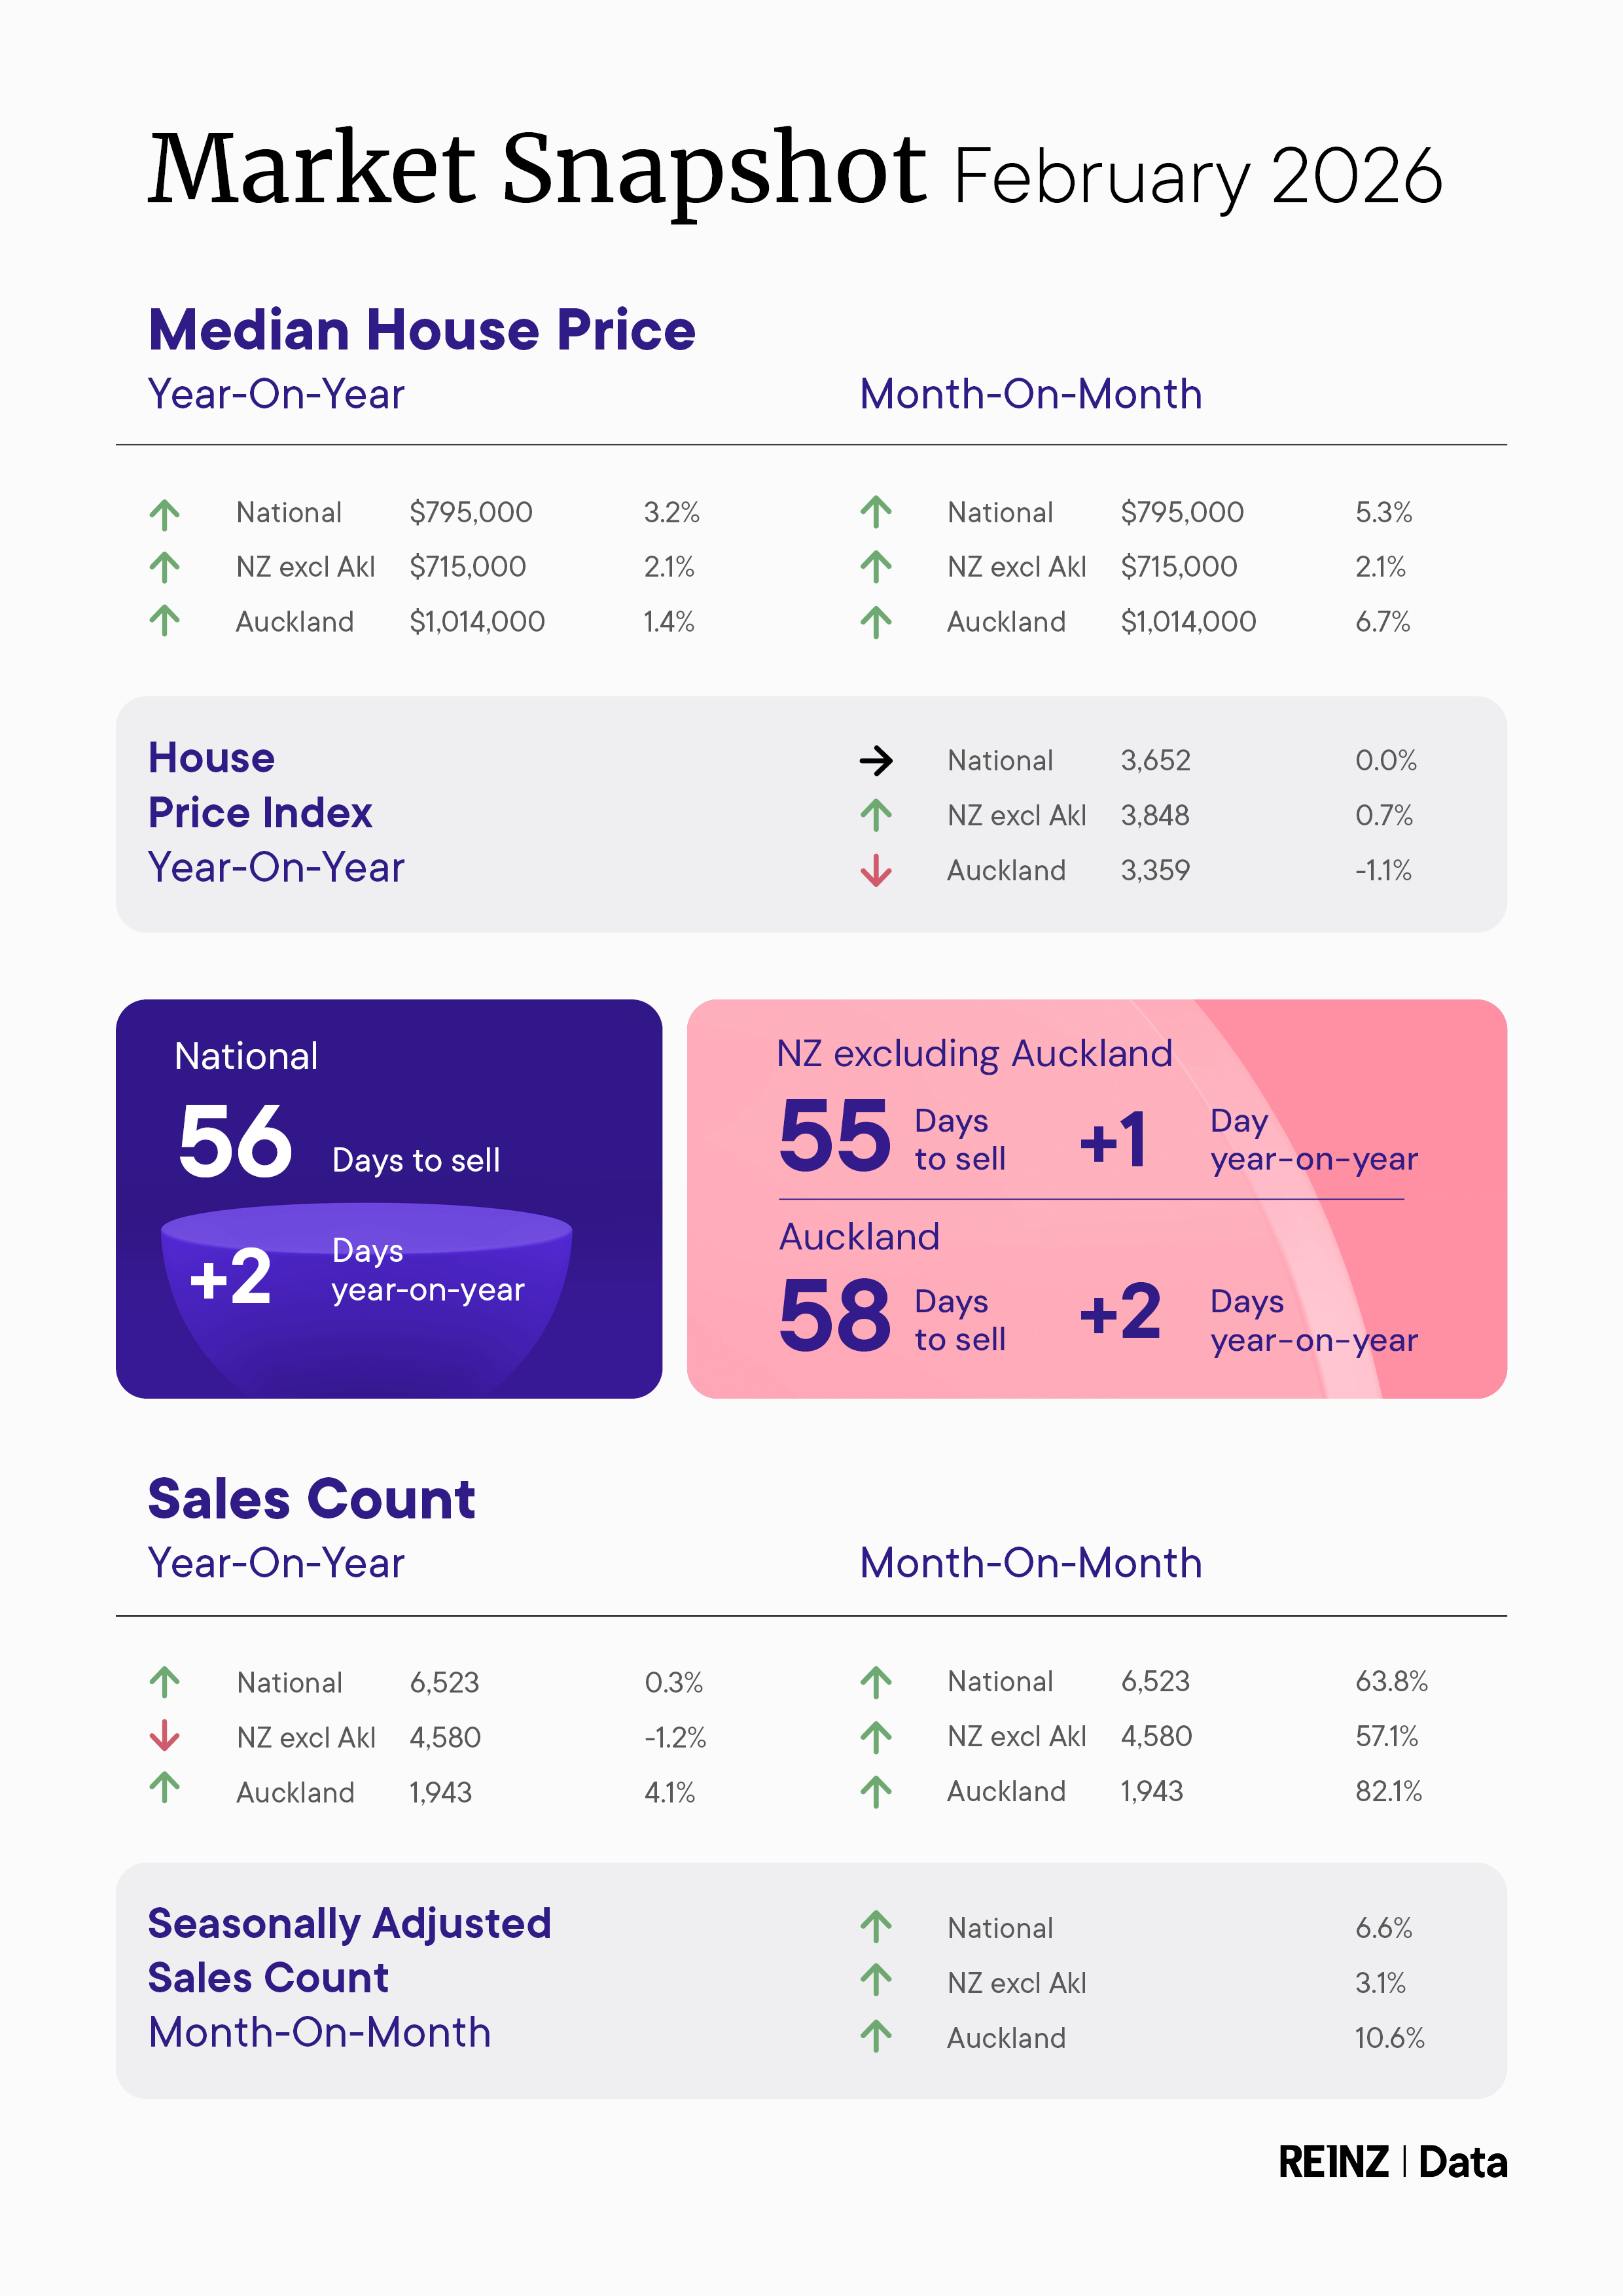
The Real Estate Institute of New Zealand reported 6523 residential sales in February, up by just 0.3% compared to February last year.
Prices were similarly stuck in the mud, with the REINZ's House Price Index (HPI) unchanged from February last year.
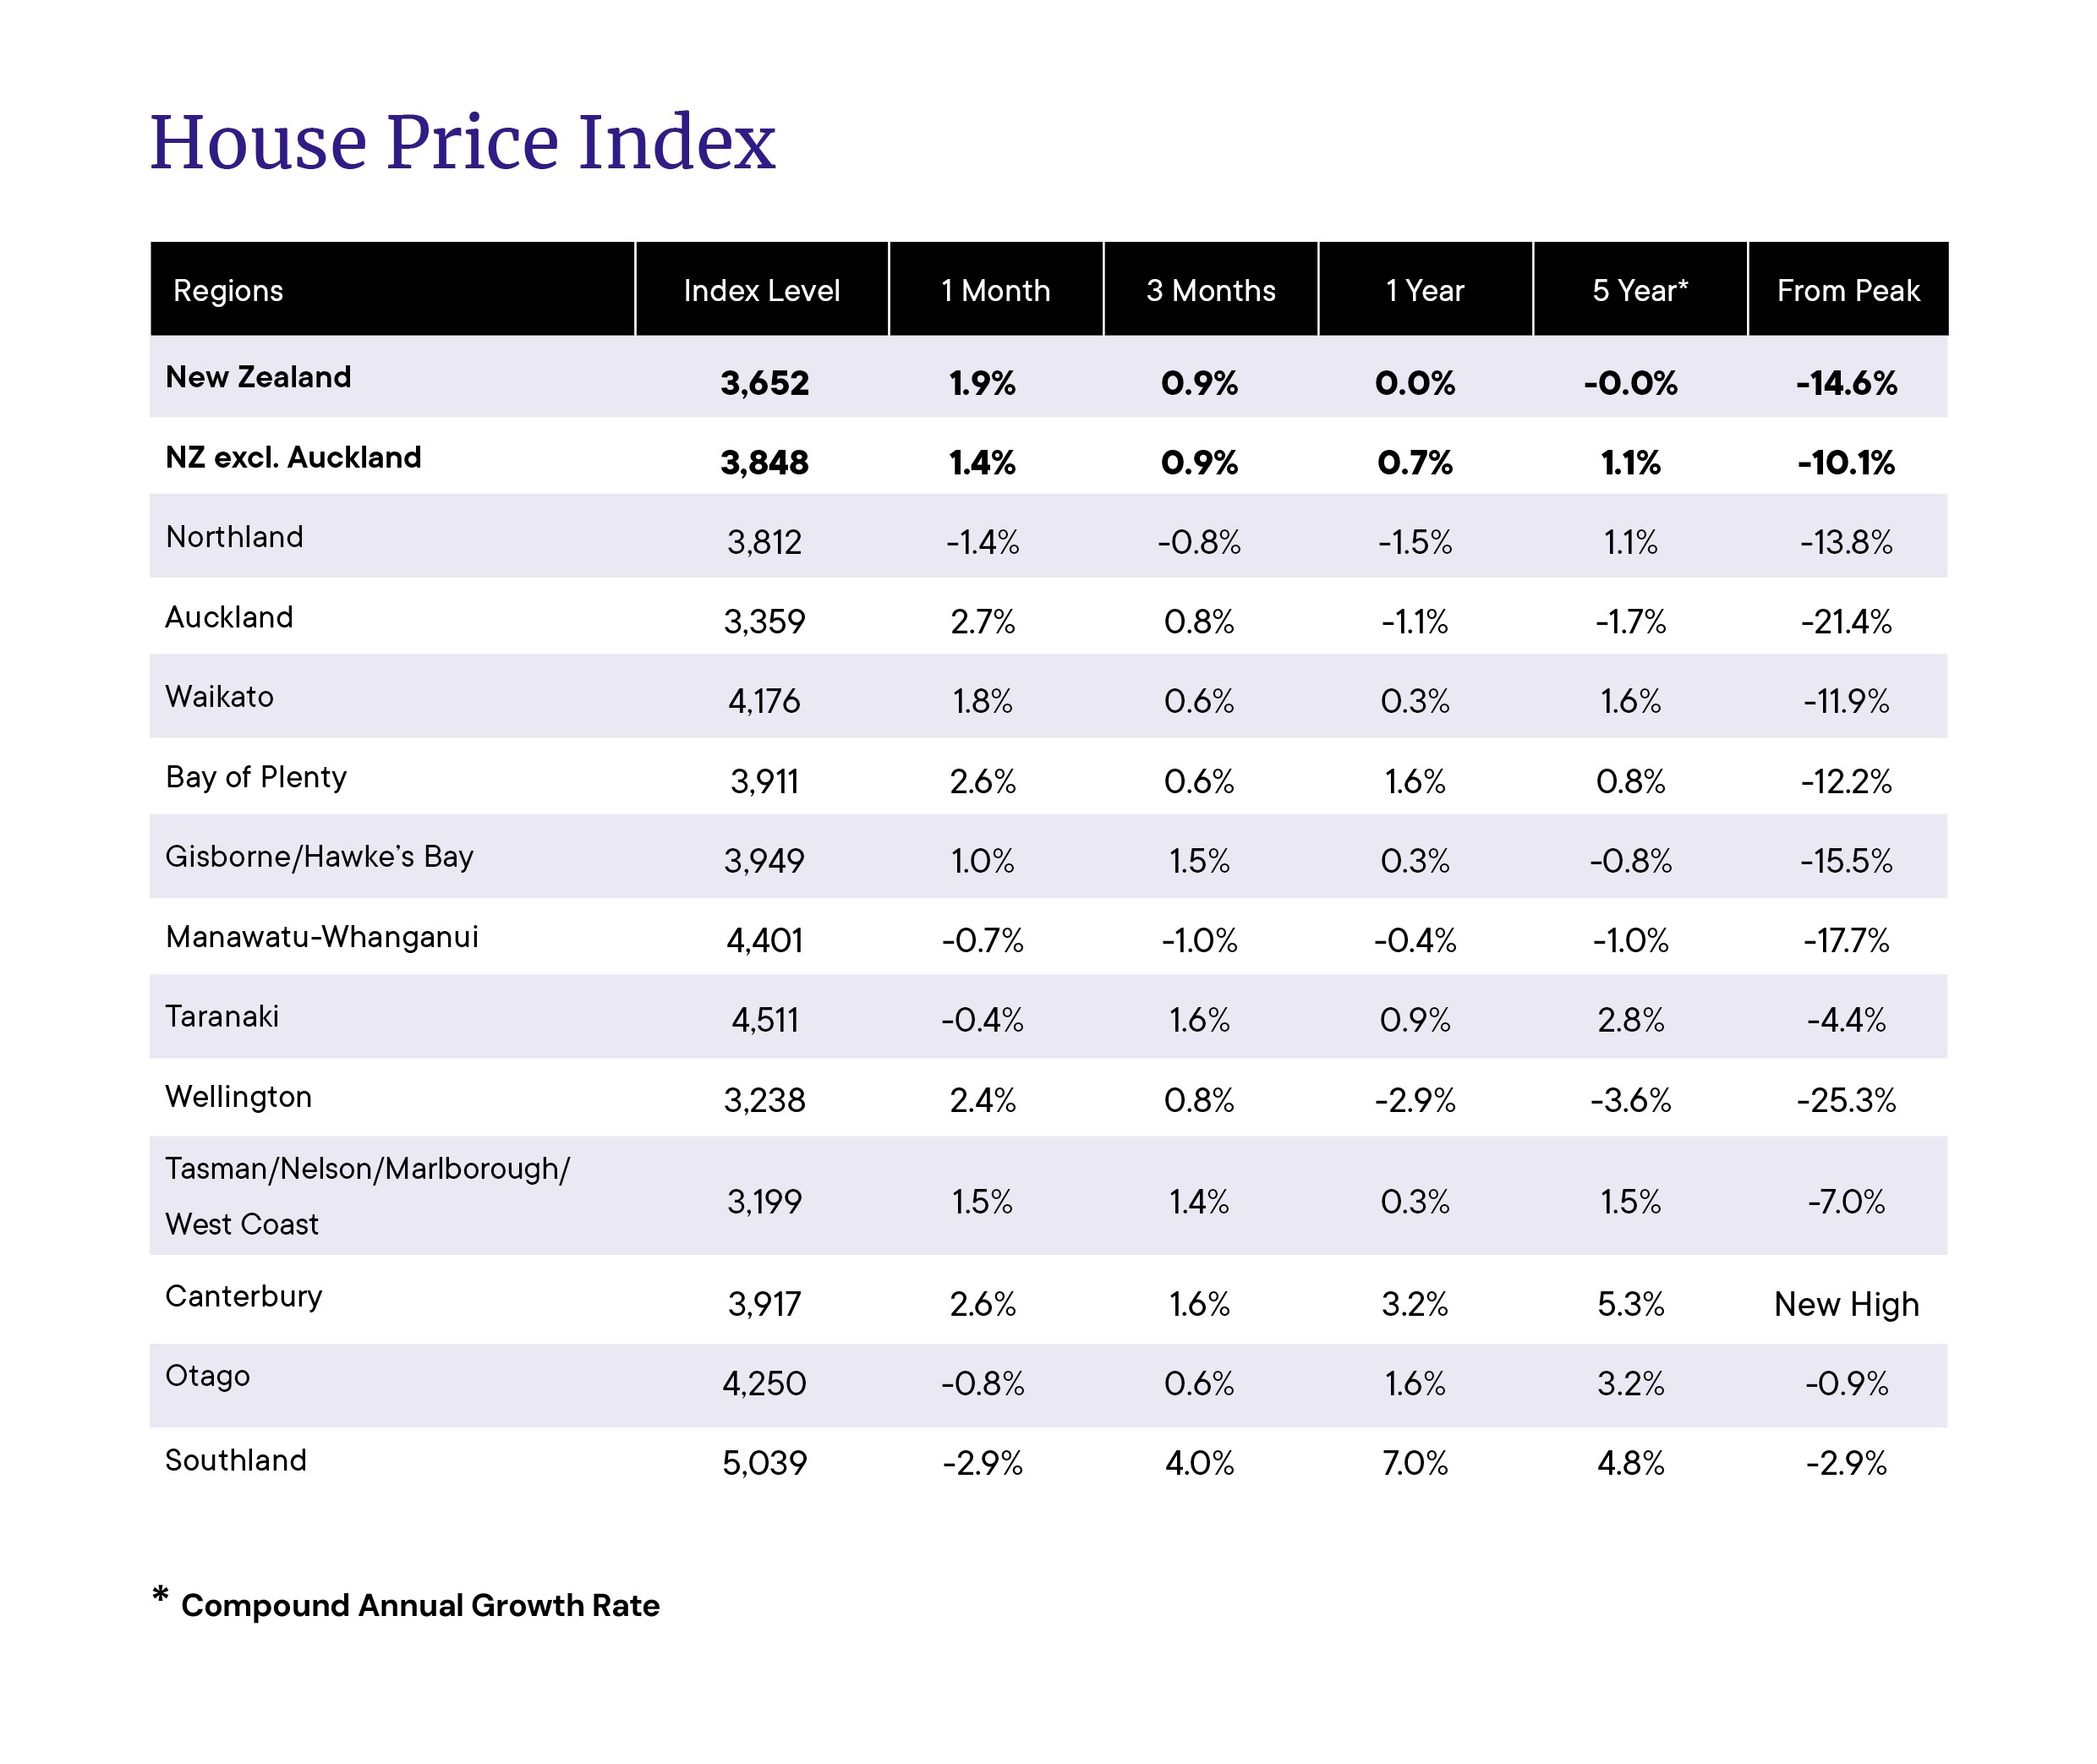
In Auckland, the country's largest real estate market market by far, the HPI was down 1.1% compared to February last year. See the table below for the full regional figures.
While sales volumes and selling prices remained unchanged overall from a year earlier, properties were taking longer to sell, with the average time it takes to sell a property increasing to 56 days in February, up by two days compared to February last year.
"Three key forces shaped market activity during February - weather, interest rates and the approaching election," REINZ Chief Executive Lizzy Ryley said.
"Severe weather disrupted activity in several regions, while the Reserve Bank's decision to hold the Official Cash Rate at 2.25% signals that the period of falling interest rates has likely ended," she said.
"The confirmation of the November election, alongside renewed policy debate around a potential capital gains tax, is also creating some uncertainty for investors," Ryley said.
The comment stream on this article is now closed.
Volumes sold - REINZ
Select chart tabs
Median price - REINZ
Select chart tabs
Days to sell - REINZ
Select chart tabs

18 Comments
"Aucklands HPI, our largest property market by far saw a 1.1% fall year on year". Prices are dropping, properties are taking longer to sell, inflation, unemployment, interest rates are all rising, business and company liquidations are at record levels, our best and brightest have left, replaced with unskilled cooks, cleaners, shopkeepers and drivers from third world countries as our cost of living rises out month on month.
Tell me again about the NZ economic recovery which is; "well and truly underway.?"
Correct in all points. You did leave grossly overpriced housing off that list. Its the no1 thing driving educated future high tax payers overseas, and has been for some time.
I dotn see any data in the report thats supporting a collapsing market narrative.
HPI is 0% YoY nationally, sales volumes are +0.3% and the median price is actually +3.2% YoY
What the charts really show is a low turnover and sideways movment since about mid 23 rather than prices falling apart.
If anything the key signal is the volumes which are still well below the long term average, so thats where the real weakness is and not price declines
Auckland is even weaker than these statistics show. On the ground, auctions mostly get passed in and if the vendor is lucky there might be 2 bidders.
If buyers were better negotiators there would be good buys out there, but they listen too much to the agent and rely on website values too much that don't reflect the number of buyers v properties
The tricky part imo is that buyers are often negotiating as a couple, inside which there is also some negotiation. Hard to get on the same page, esp when you've been through the slog of window shopping, made a selection and often paying for inspections out of your own pocket (why do we accept this?)
That and the anchoring biases that CVs and those helpful sale price "estimates" (nudges) encourage.
It’s basically flat every month, and I suspect that will continue. Down ~3% a year in real terms.
This is actually a great outcome IMO, cheaper property without the pain Ireland went through. Some unfortunate FHBs lost out if they bought for a small period at the peak.
Yeah, but they will only lose out if they sell now. The vast majority of them will do well long term.
Yeah, but they will only lose out if they sell now. The vast majority of them will do well long term.
Only time will tell but something worth considering. Is it possible for the money supply to expand without the Ponzi showing a positive relationship?
Not really. Because money supply expansion is essentially issuance of new mortgages minus repayment of mortgage debt.
Repaying a bank mortgage (or any bank loan) destroys bank-created money and, all else equal, reduces the broad money supply (bank deposits).
So what does this mean? Marginal buyers are going to have borrow money than ever before to keep the Ponzi alive.
That's a huge ask for younger demogs. The boomers are expecting a lot.
It's all relative to household income which has been increasing at a steady clip for a long time now (at a similar pace to HPI). After more than 3 years of a flat market, houses are now way more affordable than 5 years ago, so expect some decent HPI rises building through this year and into 2027.
So thems who die with the most assets while screwing everyone else win...?
Yeah nah.
The recovery continues with median house prices lifting significantly.
Knowing the time series of the median price of any data set is limited if you don't understand the mean and distribution.
A more complete “market representation” set should include:
- Median sale price by property type and location band
- Mean sale price and total transaction value/volume, often by segment
- Distributional views: price bands, percentiles (10th, 25th, 75th, 90th), or a price index such as HPI that controls for quality and mix
The Aotearoa property market is too small to get really meaningful understanding if you try to drill down so much.
My reckon is that sales volume is crucial in understanding the strength / health of the Ponzi.
The HPI is 0% for the year. Maybe you could claim some "green shoots" from the monthly HPI, but we've heard that before...
It's interesting how different perspectives are formed on the same data
"House prices show biggest monthly increase in two and a half years"
https://www.nzherald.co.nz/business/reinz-data-house-prices-show-bigges…
Just cherry pick the stat that supports your narrative - HPI, median, sales, there's usually something that's pointing up over some timeline.
Or if you want to be objective and don't need to draw clicks, just watch the HPI and get a good idea of what the market is up to. This month, looks like a hint of a small recovery showing its head but could easily fade away with seasonal variation as winter approaches. Still in the 'pretty much flat' state we've been in for a few years now. I agree with Jimbo - this is about the best we could have hoped for as a country, steadily increasing affordability without too much blood on the streets.
All data can be useful. The month on month can be used as an indicator that things are turning around, but its pretty volatile. The year on year tells us that it has been flat the last year. The HPI is the only one worth looking at.
What headline the editor chooses to get clickbait would depend on which they think will work best for their site. On interest.co.nz there are much more comments when the headline is negative.
All data can be useful. The month on month can be used as an indicator that things are turning around, but its pretty volatile.
Well yes, but many people do not really understand data beyond surface metrics. They just look at things like the median. For ex, if it's similar to the previous month or corresponding month yoy, they conclude that the Ponzi is flat or not collapsing.
You can blame our education system and media for this.
Exactly - Because Jan bombed big time, Feb was always going to look good as a comparison
We welcome your comments below. If you are not already registered, please register to comment
Remember we welcome robust, respectful and insightful debate. We don't welcome abusive or defamatory comments and will de-register those repeatedly making such comments. Our current comment policy is here.