
Affordability for first home buyers improved in November to its best level in 20 months after a slight drop in fixed mortgage rates reduced the proportion of income needed to service a home loan and because cheaper house prices were flat, the Roost Home Loan Affordability report shows.
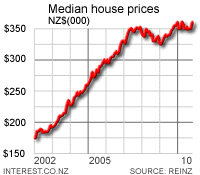
However, standard affordability for median priced home buyers deteriorated for the first time since June as the national median house price rose from October. This more than offset the benefits of another small rise in incomes and a slight fall in fixed mortgage rates.
The result underlined emerging signs of a two-speed housing market where prices of more expensive homes in Auckland and Wellington are firmer than entry level and investment properties in the outer suburbs and in provincial cities, where prices are weakening and buyers have the upper hand.
“First home buyers are in a much stronger position than at any time since the recession,” said Margaret Smith, spokeswoman for mortgage broking group Roost Home Loans.
“Affordability for young couples has improved dramatically to the best levels seen since early 2005 and now buyers have a lot more choice after a surge in listings through November,” Smith said.
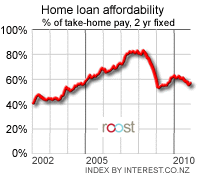 A young couple earning the median wage can afford to buy a first quartile priced house with 23.6% of their disposable income required to service an 80% mortgage. This is down from 23.8% in October and down from a June 2007 high of 35.1%.
First home buyer household affordability is at the best levels since February 2005. The national median house price rose to NZ$360,000 in November from NZ$350,000 in October as sales of more expensive houses in central Auckland and Wellington picked up after income tax windfalls for those on the highest salaries.
However, the first quartile house price was flat at NZ$250,000 and remains below its March 2010 peak of NZ$257,100.
The Roost Home Loan Affordability report measures affordability nationally and regionally for individual income earners and households, taking into account median house prices, interest rates and incomes.
The Roost Home Loan Affordability measure for all of New Zealand showed the proportion of a single median after tax income needed to service an 80% mortgage on a median house deteriorated to 56.8% in November from 55.7% in October.
Affordability worsened most in central Auckland and central Wellington where luxury home prices were firm, but improved the most in provincial cities such Whangarei, Napier, New Plymouth, Timaru and Dunedin where prices were flat to falling.
Invercargill remains the most affordable city in New Zealand, but only just ahead of Wanganui after a rise in house prices in the southern most city worsened affordability slightly. Queenstown retained its top spot as the least affordable city, but was closely followed by Auckland Central.
Affordability has been improving since December 2009 as house prices have flattened out and interest rates have fallen, the monthly measure calculated by interest.co.nz in association with Roost found.
 Most home owners are still on fixed mortgages, but more new borrowers are choosing to float, given floating rates at around 6.2% are cheaper than average longer term fixed rates at around 6.6%.
However, the gap has closed over recent months as fixed rates have fallen from 7.25% five months, making the fixed vs floating decision more evenly balanced. Home loan affordability hit its worst level of 83.4% in March 2008 just after house prices peaked and 2 year mortgage rates were close to 10%.
Affordability is difficult in Auckland, Wellington, Christchurch, Hamilton and Tauranga for those on a single median income, but homebuyers in smaller provincial cities will find home ownership much more affordable. Households with two incomes are also in a stronger position, particularly those bidding for homes priced in the lower quarter. Affordability for households with more than one income worsened slightly in November because of the rise in the median house price.
This measure of a ‘standard typical household' found the proportion of after tax income needed to service the mortgage on a median house rose to 38.5% from 37.7% in October. This measure assumes one median male income, half a median female income aged 30-35 and a 5 year old child that receives Working-for-Families benefits.
Any level over 40% is considered unaffordable for a household, whereas any level closer to 30% has coincided with increased buyer demand in the past. The survey’s measure of a ‘standard first-home-buyer household' found the proportion of after tax income needed to service the mortgage on a first quartile home fell to 23.6% in November from 23.8% in October.
This measure assumes a first home buyer household includes a median male income and a median female income aged 25-29 with no children. Any level over 30% is considered unaffordable in the longer term for such a household, while any level closer to 20% is seen as attractive and coinciding with strong demand.
Full regional reports are available below:
- New Zealand (159kb .pdf)
- Northland (159kb .pdf)
- Whangarei (159kb .pdf)
- Auckland region (159kb .pdf)
- Auckland Central (159kb .pdf)
- Auckland North Shore (159kb .pdf)
- Auckland South(159kb .pdf)
- Auckland West(159kb .pdf)
- Waikato and Bay of Plenty (159kb .pdf)
- Hamilton (159kb .pdf)
- Tauranga (159kb .pdf)
- Rotorua (159kb .pdf)
- Hawkes Bay and Gisborne (159kb .pdf)
- Napier (159kb .pdf)
- Hastings (159kb .pdf)
- Gisborne (159kb .pdf)
- Taranaki (159kb .pdf)
- New Plymouth (159kb .pdf)
- Manawatu and Wanganui(159kb .pdf)
- Palmerston North(159kb .pdf)
- Wanganui(159kb .pdf)
- Wellington region (159kb .pdf)
- Wellington City (159kb .pdf)
- Wellington Hutt Valley(159kb .pdf)
- Porirua (159kb .pdf)
- Kapiti Coast (159kb .pdf)
- Nelson and Marlborough (159kb .pdf)
- Nelson (159kb .pdf)
- Canterbury (156kb .pdf)
- Christchurch (156kb .pdf)
- Timaru (156kb .pdf)
- Central Otago Lakes (159kb .pdf)
- Queenstown (159kb .pdf)
- Otago (159kb .pdf)
- Dunedin (159kb .pdf)
- Southland (159kb .pdf)
- Invercargill (159kb .pdf)
| Regional home loan affordability comparison: | ||||||
| mortgage payment as a % of weekly take-home pay | ||||||
|
Nov-10
|
Oct-10
|
Nov-09
|
Nov-08
|
Nov-07
|
Nov-06
|
|
| New Zealand |
56.8%
|
55.7%
|
61.8%
|
64.2%
|
83.0%
|
72.9%
|
| Northland |
53.9%
|
55.3%
|
65.5%
|
67.0%
|
78.6%
|
68.3%
|
| - Whangarei |
47.1%
|
51.1%
|
58.2%
|
58.0%
|
76.3%
|
62.5%
|
| Auckland |
71.0%
|
69.0%
|
77.2%
|
76.1%
|
99.2%
|
87.5%
|
| - Central |
79.5%
|
66.7%
|
83.6%
|
77.8%
|
107.3%
|
93.5%
|
| - North Shore |
75.3%
|
72.8%
|
84.2%
|
83.5%
|
109.8%
|
92.6%
|
| - South |
71.2%
|
70.2%
|
77.6%
|
75.2%
|
98.9%
|
86.3%
|
| - West |
60.4%
|
59.2%
|
64.8%
|
67.1%
|
87.7%
|
73.5%
|
| Waikato/BOP |
53.5%
|
51.6%
|
59.3%
|
60.9%
|
80.5%
|
71.2%
|
| - Hamilton |
54.5%
|
56.0%
|
61.1%
|
64.3%
|
81.0%
|
72.1%
|
| - Tauranga |
57.1%
|
55.1%
|
68.3%
|
67.2%
|
98.9%
|
80.7%
|
| - Rotorua |
44.8%
|
38.0%
|
42.8%
|
44.6%
|
63.7%
|
55.7%
|
| Hawkes Bay |
47.7%
|
51.4%
|
53.9%
|
61.9%
|
72.6%
|
67.7%
|
| - Napier |
50.9%
|
56.3%
|
55.4%
|
61.8%
|
82.6%
|
72.6%
|
| - Hastings |
48.7%
|
51.0%
|
55.6%
|
60.9%
|
70.0%
|
64.2%
|
| - Gisborne |
51.4%
|
49.6%
|
55.3%
|
56.2%
|
73.7%
|
64.3%
|
| Manawatu/Wanganui |
39.9%
|
40.3%
|
43.6%
|
47.2%
|
58.8%
|
50.2%
|
| - Palmerston North |
44.5%
|
47.0%
|
48.0%
|
49.0%
|
69.4%
|
57.8%
|
| - Wanganui |
35.4%
|
31.6%
|
37.9%
|
41.8%
|
52.5%
|
43.9%
|
| Taranaki |
45.4%
|
49.3%
|
52.5%
|
53.5%
|
71.0%
|
63.9%
|
| - New Plymouth |
50.6%
|
55.4%
|
65.1%
|
64.6%
|
79.9%
|
70.8%
|
| Wellington region |
58.5%
|
57.6%
|
63.2%
|
64.9%
|
86.6%
|
75.9%
|
| - City |
66.3%
|
59.8%
|
75.0%
|
68.0%
|
90.3%
|
80.7%
|
| - Hutt Valley |
53.0%
|
53.1%
|
56.3%
|
57.2%
|
72.4%
|
64.4%
|
| - Porirua |
61.0%
|
54.3%
|
65.7%
|
71.6%
|
92.8%
|
75.2%
|
| - Kapiti Coast |
57.2%
|
54.2%
|
58.6%
|
62.3%
|
83.6%
|
71.2%
|
| Nelson/Marlborough |
57.6%
|
56.3%
|
62.9%
|
70.6%
|
86.1%
|
77.6%
|
| - Nelson |
59.3%
|
60.7%
|
61.7%
|
68.7%
|
79.8%
|
71.9%
|
| Canterbury/Westland |
49.9%
|
51.7%
|
55.6%
|
58.9%
|
77.1%
|
66.9%
|
| - Christchurch |
54.4%
|
56.9%
|
63.2%
|
64.4%
|
83.9%
|
74.8%
|
| - Timaru |
37.2%
|
42.5%
|
43.5%
|
42.8%
|
62.2%
|
51.2%
|
| Central Otago Lakes |
71.8%
|
66.3%
|
83.1%
|
97.3%
|
109.7%
|
93.5%
|
| - Queenstown |
81.9%
|
82.2%
|
105.6%
|
101.9%
|
120.9%
|
122.9%
|
| Otago |
39.2%
|
42.2%
|
45.3%
|
45.7%
|
59.9%
|
56.0%
|
| - Dunedin |
43.3%
|
48.0%
|
52.0%
|
50.9%
|
68.3%
|
63.1%
|
| Southland |
32.4%
|
29.3%
|
34.5%
|
34.0%
|
54.1%
|
37.3%
|
| - Invercargill |
35.2%
|
30.9%
|
38.9%
|
37.8%
|
55.3%
|
41.9%
|
No chart with that title exists.
31 Comments
Not only am I too old be at university, but it would be doubtful I would ever pay of a mortgage at current price levels for housing before I retired. Just as well I don't have a mortgage and recognised a few years ago now that the house of cards would eventually fall down.
I will be able to afford a home, but it will be at the expense of some other poor sod who didn't know or give credit to the principle 'Caveat Emptor'.
it will be at the expense of some other poor sod who didn't know or give credit to the principle 'Caveat Emptor'.
Such people are too stupid and greedy to deserve any sympathy.
Yes true in a lot of instances, but there will be a certain percentage that have been thoroughly deceived.
I still remember buying my first home back in 95 only to see the value drop by 25% over the next three years. I had no idea I was buying on the high and only found out when I needed to sell. I got my money back in the end by waiting, and by being fortunate it was positive yielding.
But I can only nod and smile when people say to me that property never goes down.
Trouble is those who were naive won't get the come around that I got.
Trouble is Hugh is that during my Urban Design lectures this past semester Houston was shown as an example of urban sprawl. My comments to the professor about someone I knew that moved there was met with a quite disparaging remark.
Houston might be good for economics but it isn't a good model for urban design.
Zoning laws are the antithesis of good urban design, so yes I agree the economic principle you preach is right, but the execution is wrong. Higher density please. 30-60 per acre, but it is how it is done that is important.
Are those lending practies applicable to NZ Hugh? Isn't it apples and oranges? I would love t have those prices...
Hey Hugh
'It is difficult to understand why the Clark Labour Government allowed our housing bubble to get underway here between 2002 and 2007'
Genuine Question: Were you railing against Clark and Cullen for allowing a bubble at the time? Also, were you refusing, on principle, to be the direct/indirect recipient of such poor economic management?
If so, could you please post an example of your writings during the period? I will be your biggest fan.
Regards
Haggis
Mate that's a fun question many have asked of these I Told You So people who all of a sudden appeared out of nowhere well after the fact!
Well Hugh if development doesn't fall into the density of 30-60 people per acre then it is sprawl.
I agree with you entirely that our housing is overpriced and our construction industry inefficient.
Buy the trouble with the design densities you advocate is that they all cater to and require the motor car, which is death to communities. You simply don't have good living spaces when the motor car is involved. Not to mention is issue of diminishing energy supply with which to run those cars.
It doesn't matter if the housing is more affordable or not, it will all be pulled down one day because it isn't good to live in. (unfortunately there are plenty of examples of poorly designed high density that have suffered this fate)
What is the economic cost of that? All that embodied energy wasted.
Have you looked at the embodied energy of the housing you promote?
Average to construct a house in Auckland is 500,000 Kw/hrs, over $100,000 if calculated at current electricity prices. Compare that to 100 years ago when it was almost nil. I would hate to think what it is with the dispersed nature of those cities you highlight., the USA is only doing it on the back of cheap oil. Not only this this style of development psychologically unhealthy, it is not sustainable
I agree with you Hugh,
Imagine what you could buy and the retail lift that would occur if you didn't have to spend so much damn money on servicing a mortgage just so you can have a roof over your head.
You are right all we are doing is keeping the banks profit levels up and bossess bonus' up and very little else.
My view.....Homes are still seriously unaffordable...the govt doesn't give a bloody stuff...the Reserve Bank is working to keep them that way.....young people should not borrow from any of the banks....they will be conned into supporting the situation which traps them for life as serfs to a bank.
The savings working group have wasted their time but they served a govt need to sidetrack the media. The level of saving will not rise because the banks have a deathlike grip on incomes due to the bubbles.
This is the same in the rural regions where banks have wormed their way into the lives of farming families. Sheep farmers can detect worms in an animal at a hundred yards...they need to start looking at themselves and their business models with the same eyes.
Young families in NZ ought to look for different and far less expensive types of accomodation and recognise that they are being 'managed' by a system intent on farming them. Opt for pooling resources....recognise that the demise of the old farts will see a massive number of properties coming onto the market. This trend can only get stronger.
Deflation and dollar debasement are here to stay. Buy only what you really need. Grow or catch the rest. Learn to trade your eggs for their spuds etc. Use the banks to your advantage. Save enough to make it worthwhile to buy aussie dollars and bank your wealth over there. You have no reason to support a system that sees you as a target.
The message is clear Wally, but how many spuds are necessary to fill the car?
A good debate (playing devil's advocate) is 'Banks CAN make you take credit'.
When Lucinda needs her teeth staightened.
When the paint peels off the house ($20,000).
The new kitchen ($15,000).
Retro fitting insulation...
The power bill...
When the car craps out.
Even the 'green' options cost to install.
All these things cost money that most don't have!
That its all been tied up in mortgages seems clear. Even better that the housing falls to bits.
Scarfie parrots the myths about urban sprawl and the need for density, that are doing just as much damage as the early 2000's myths about the new paradigm for endless economic growth based on low-interest debt. Just as very few people were right in 2003 about the existence of a new bubble based on mortgage debt, very few people are right today about the futility of "urban limits" and their role in economic bubbles of an unprecedented magnitude to anything experienced before.
It is my opinion that World Bank Economist Alain Bertaud should get a Nobel Prize in Economics, for his papers that show the following:
".......While a high or a low density does not have necessarily negative effect per se, a positively sloped density gradient constitutes always a liability for a city. For a given average density, in a city with a positive gradient, the median distance per person to the CBD will always be longer than in an equivalent city with a negative gradient. It is reasonable to infer that in a city with a positively sloped gradient ALL trips would be longer......:"
".........SPATIAL DISTRIBUTION OF DENSITY itself is more important in city performance than whether a city is monocentric or polycentric......"
"...... As predicted, land prices are going up because of the supply constraint imposed by the UGB, developers respond by developing higher density housing in the vacant areas between the limits of the current built-up area and the UGB. This of course has a tendency to reverse the slope of the gradient.........In the long run, the higher density which will built-up on the vacant land along the UGB will increase the accessibility of suburban shopping malls at the expense of the relative accessibility of the CBD. This is not the outcome that the planners intended......." ".......instead of being able to make a trade-off between distance and land consumption........" "........the practical outcome of a positive density gradient is longer trips for more people....." Bertaud's "Figure 9" plots outcomes for his sample of cities with "Average distance per person to the CBD" on one axis, and "City built-up area" on the other, to compare the efficiencies of each city's "spatial distribution of density". "....... The calculation of d allows us to have a measure of the diseconomy brought about by a positively sloped density gradient. Moscow, because of its positive density gradient has an average distance d per person to the center that is 32% longer than an equivalent city (i.e. same population, same area and of course same average density) that would have a negatively sloped gradient similar to, say, London or Marseille. While the variations in the value of d represent a geometric concept, there is no doubt that there should be a strong correlation between d and the average distance traveled everyday, whether the city is monocentric or polycentric. Portland and Curitiba perform barely better than Moscow and significantly worse than the other cities, this is the effect of the "disturbed" density gradient of these 2 cities....." Bertaud's "Figure 10" graphs the cities according to "comparative dispersion index". ".......We can see that market cities have different values for ρ that are clustered between 0.82 for Jakarta to 1.03 for Hyderabad. The three utopian cities are clear outliers, with the milder utopian cities Portland and Curitiba performing significantly better than the utopian cities but not as well than the market cities. We should note also that many urban commentators often associate higher densities with more compactness and shorter trips. We can see from Figure 9 and 10 that there is no necessary correlation between shortness of trips and densities. The way densities are distributed in the built-up area is far more important than the value of the average density........" "......Dispersion increases the operational cost of a city by increasing the length of networks. It also increases the use of energy for transport and as a consequence it increases also air pollution. One should note that there is no direct inverse correlation between density and dispersion, contrary to what is generally thought.......
".........When planners try to improve urban design, i.e. when their intervention stays at the neighbourhood level, the market can easily test their success or failure. For instance, the impact of a well designed, planner initiated, pedestrian street can be assessed by the increase or decrease of property values along the street, reflecting the positive or negative acceptability of the design by the general public. It is expected that by trials and errors planners could develop an experience, probably unique to each city, which allows them to improve the quality of the urban environment by designing and regulating the use of public space in close harmony with the demand driven use of private space. This coordination is always difficult if not impossible to accomplish by the private sector alone when relying on pure market mechanisms. However, planners often attempt to apply at the metropolitan level the practice of designing by the proxy of regulations. Attempts to "design" or reshape an entire city through land regulations have unpredictable negative side effects, as the examples in this paper have shown. Measuring the economic costs and benefits of shaping a metropolitan area through regulations is a complex operation very different from measuring the performance of planners intervention in urban design. At the metropolitan level, positive or negative results appear only after a long time. Given the time resilience of urban shape, it is dangerous to engage in experiments that may prove to shape cities in an irreversible way......."
I have said this on here before: if you look at the worst cases of unaffordable housing in the Demographia surveys, then look at them on Google "Earth", you can see for yourself the effect that Bertaud is describing. DENSITY, DENSITY, DENSITY, MILES AWAY FROM THE CBD; ending at the urban growth boundary with an abrupt cut-off into green fields or wilderness. Look at Los Angeles, look at Sydney, look at Vancouver. Look at Auckland.
"Spatial Distribution of Density", Scarfie - THAT is the term that the urban planning profession desperately should have got its head around years ago when Bertaud published his paper. When land prices are low, the "spatial distribution of density" is WHERE IT SHOULD BE. The density is greatest near the CBD, and tapers off to the periphery. The result of what Bertaud calls a "disturbed density curve gradient", is LONGER AVERAGE COMMUTES, Scarfie. THAT is what Urban Planner are doing to us, Scarfie; loading us with mortgage debt, for NOTHING. They are NOT EVEN ACHIEVING THE "BENEFITS" you claim, by way of "offset" to the costs of houses and mortgages.
Let me refer to some more studies: the ones done by Paul Cheshire and Stephen Sheppard of the London School of Economics on "The Welfare Effect of Land Use Planning".
"Although directed to the British system of Town and Country Planning this paper has relevance for many OECD countries, including some with systems of land use regulation which evolved entirely independently of the British. The paper starts by characterising the basic features of the British land use planning system, viewed from the resource allocation point of view of an economist. A conclusion is that the system explicitly excludes any use of price signals from its decisions. The paper then summarises the problems which the exclusion of price information has given rise to. Because the UK planning system has deliberately constrained the supply of space, and space is an attribute of housing which is income elastic in demand, rising incomes not only drive rising real house prices but also mean that land prices have risen considerably faster than house prices. Several housing attributes other than garden space are to a degree substitutes for land but the underlying cause of the inelastic supply of housing in the UK is the constraint on land supply........."
".......Policies of containment and densification limit the supply of land (and also space), not just for housing but for all non-agricultural land use in Britain. Our system of designated land use categories and development control imposes considerable costs. Where a full net welfare evaluation has been possible – for a tightly constrained urban area in South East England – it shows that the increased costs of space for housing substantially exceed the value of planning amenities generated, imposing a net welfare loss equivalent to a tax of 3.9% on incomes.
Eliminating that welfare loss by substantially relaxing the constraint on land supply policy was estimated to increase the urban land take by 70%. Given that the total area of greenbelt land alone is 1.5 times the total urbanised area, even such a strong relaxation of containment policy as this would leave very substantial areas of greenbelt, and even if all additional urban land was taken from existing greenbelt areas.
This evidence is now quite old. But given what has happened to prices for housing land relative to agricultural land over the intervening period, and the evidence that the valuation of greenbelt amenities has fallen rather than risen, it is almost certain that the net welfare cost today would exceed the earlier value. There is also evidence that the planning system is imposing higher costs on productive uses of land.........."
"......Making the planning system responsive to price signals and less arbitrary in its impact on land supply may seem problematic. But doing nothing is in the long run even more problematic. House prices may not collapse from the 2004 boom; but they may. We do know that if land supply does not become more responsive to underlying demand, all the problems identified in section 2 of this paper will become cumulatively worse".
(THIS WAS IN 2005....!)
Houses are not meant to be affordable...you are meant to pay as much as you can afford in interest to the banks. That is the plan. What follows is about the US but its no different here
Michael Hudson's excellent interview
Quote
"Alan Greenspan explained this very clearly a decade ago. He said there’s something wonderful about debt: it’s cured the labor problem. The workers are now one paycheck away from homelessness. If they go on strike or if they’re fired because they complain about working conditions, all of a sudden their interest rate goes up on their credit card, all of a sudden they miss their mortgage payment, they’re losing their home. Alan Greenspan said debt is what has created stability of wages in this country, meaning steadily falling wages.
In America, despite the amazing rise in productivity we’ve had in the last 30 years, real wages have actually gone down. All of the increase in productivity has been taken by the finance, insurance, and real estate sector, called the FIRE sector, almost all of it by the financial sector. So all of this growth has been siphoned off, not taking the form of rising living standards, but taking the form of debt service, mainly interest and fees. The fees are as large as interest for the credit card companies. So it’s all siphoned off financially.
So instead of having industrial capitalism a century ago, we have a finance capitalism that actually is stifling industrial capitalism here. So what Alan Greenspan and others call the postindustrial economy is really neo-feudalism. It’s a financialized economy where all of the surplus goes to the banks. And if you’re a banker and somebody comes in and wants to take out a loan, you say, how much do you make? How much do you spend on food? You realize that most people, most workers in America have to spend 20 percent of their income just on basic goods and services–food, clothing, transportation to get to work. Everything over that, they think that’s all available to be paid to the banks. The idea of a banker is for the entire economic surplus to be paid in the form of a financial surplus."
Unquote.
And so it came to pass here PPP...Labour blindly helped blow the bubbles when they ought to have done the opposite...but then no bubble would have crimped the socialist landlords building their 'superannuation' topups
Now we are daft enough to think a National coalition will clamp down hard on the bubbles...squeeze the banks and balance the economy...bring about a state of saving and prudence....what bloody fools we are.
It really is down to each of us to do what we can and that means avoiding debt...being prudent...because chances are Tweak and Fiddle and Co with the help of Bolly Treasury and all...will likely lead us into permanent serfdom.
Nothing wrong with running chooks...sharing a 'Predator' ...using a crossbow or 22...growing the veg and eating the hedge.
It's those damn socialists again, eh Wolly?
Always the socialists.
Of course, had Labour (or any govt) attempted to crush the property bubble, they would have been deafened by the howls of outrage from the 'ordinary Kiwis'.
It would definitely have been a one-way ticket to a landslide election defeat!
The bubble was very popular with almost everyone up until it burst, but especially the capitalists among us. Indeed, even now many Kiwis are doing their damndest to reinflate the fast collapsing property bubble.
Quite right Basket...'populist socialists'.....the cause of all our current problems. Why did the state sector grow to become so bloated under Clark.......How many public salary jobs did the Labour party president have......Why did the real economy grow so little in those years under Clark.
Thanks, but I think we're all well aware of the root causes and have been discussing them for a long time.
Wolly loves to blame "socialists" for everything bad that's ever happened since the Big Bang (although it's obvious he has no clue what a socialist or socialism really is), but even Wolly knows who and what is to blame, as do the rest of us.
edible hedge - great idea must google it.
It just came to me KJW....Blueberries seem to be ok and maybe passionfruit vines....
Feijoas ! You can clip them into a hedge shape , and still get some fruit .
Makes you wonder why peasants plant hedges they can't eat and cover their tiny plots in weedy grass or concrete. Those high rise Auckland slum apartment buildings could have become the hanging gardens of Auckland!....just the effort was missing.
Well Hugh I think that is good news, the buck ultimately had to stop at local government as they were taking peoples money to ensure compliance that buildings were safe and habitable. By taking the fees they are ultimately culpable,and it is reprehensible they have spent so much money trying to evade their responsibilities.
I will be glad to see a reduction to the bureaucracies as a price to pay for their incompetence.
I suspect the same band of people are responsible for smart growth ( I create post another response for that discussion)
It is just a shame that ratepayers will share some of the burden, but hopefully it will sharpen their minds.
I remain thankful that I am not currently a ratepayer.
You two fail to see the wood for the rotten trees....the local bodies!...will pass the cost on to ratepayers quick as slapping a polly on a barby...and employ more staff to cope with the extra admin...which will mean the bosses will demand more pay for looking after more bums on seats...oops they will need more seats for the bums and so up go the rates to extend the council office space..dam that means they need more furniture....on and on and on it goes where it stop no bugger knows......
Increase, to $75 million a day, the nations borrowings, and we'll have the 'leaky debt' knocked off in no time at all! Makes the current $35 million per day, and your noted $50 million per day to cover last weeks blow~out, look comfortingly modest....Now, as for pay back.....Well that's just a bit more for 'junior' to work with in due course....
Phil and Hugh,
since when have I expressed being being a proponent of smart growth? I think you will find I have posted as being a opponent. High density does not equal smart growth, and I don't see why high density can not co exist with free urban limits. The issue not addressed by either of you is the problems that arise from zoning. This is a 20th C problem that arose from the work of Corbusier.
On the same note I have read some of your links Hugh and find the research flawed, because it uses higher density smart growth areas as subjects for comparison. My urban design paper did not use these as model examples of housing. You won't really find any contemporary examples, only small enclaves within greater schemes. I have mentioned Jorn Utzon's Kingo houses, and a local example in Kensington Park, Orewa. The Kingo houses are rarely put on the market as the resident don't want to move.
If you want to look for models, look to pre motor car areas in europe. Italy in particular.
Dr. Tony Recse makes out that the Garden city solved the problem of slums, but that is far from the case. Garden cities were more a theory than an actuality. Only a few were ever built at the hand of a few philanthropists such as Cadbury and Sunlight. The slums were never really solved, but rather evolved. In some respects the worker housing in New Zealand is worse than 18thC England. The only difference being improvements in sanitation. We owe our urban design heritage to the middle class housing of the 17th and 18th C England. Those that emigrated aspired to improve their lot and copied what they knew as 'better'. Doesn't mean it was good though, and we still suffer from this mistake.
Phil your link to the study on densities faces the same problem, it is linked with smart growth, and I agree that doesn't work. There is plenty of work to show how cities can be high density and work, look to the publications of Christopher Alexander.
I don't know if the houses illustrated in the 6th Annual Demographia International Housing Affordability Survey: 2010 are included as good examples Hugh, but I hope not. They are great examples of unsustainable, psychologically damaging designs, that will be unlikely to make it to the end of their 50 year design life.
The trouble with housing like this is it is part and parcel of the system that many interest.co junkies recognise as flawed. Houses sponsored by irresponsible bankers.
Where is the thermal mass, aspect window/floor area ratio, solar water heaters etc.
Heck they all look like leakers also.
It is junk housing made to make people feel like they are somebody. It is just a veneer.
Hope your respective weekends are going well.
Cheers
Scarfie
PS. Without the benefit of academic study I have always known subconciously that our urban living was unhealthy. I have not participated in it for most of my adult life.
Thanks, Scarfie. I think you and I can really get along.
I have had a quick read-up about Christopher Alexander. One thing I like, is his open-mindedness about Shanty Towns and presumably informal housing. I take from this, that he is in favour of "Freedom to Build", and people being allowed to cut their cloth to suit their incomes. I have read a bit by John F. Charlewood Turner. I also recommend "We House, You are Housed, They are Homeless" by Colin Ward.
I take it you are also familiar with Hernando DeSoto's "The Mystery of Capital". And the "AudaCity" organisation in Britain?
Alain Bertaud remains my most respected author on urban economics; you would be very interested in his
"Land Markets, Government Interventions, and Housing Affordability". He analyses the need for government regulators in countries where there is "informal housing", to make regulatory allowance for what people CAN afford, so they can do it legally.
Also try "How Government Creates Poverty as We Know It" by Charles Johnson. Nothing creates poverty like government regulations that do not allow the lowest income earners to cut their cloth according to their incomes when it comes to housing. There is effectively NO bottom 3 rungs at all on the housing ladder when "Smart Growth" has forced the price of land up.
The way housing unaffordability has gone in NZ, Australia, Britain, Ireland, California, etc; WE should all have an "informal housing" sector too. "AudaCity" in Britain has been threatening to create an "illegal settlement" somewhere to raise public awareness.
I do not notice anywhere that I have read about Christopher Alexander, as yet, that he bothers to analyse land prices and the way regulations distort these. If he does get into this at all, please tell me where, and I will certainly follow it up.
I agree very much with what I think you are saying about the functionability of certain very old cities that were never subjected to "urban renewal". But what planners all need to recognise is that in young countries, or where urban renewal and "sprawl" have already taken place, it is TOO LATE to FORCE a return to that ideal urban form without imposing impossible costs on society. There IS a certain amount of DE-regulation that does help, like eliminating "MINIMUM" section size regulations; this and other aspects of "Smart Growth" are not silly. When people like me refer critically to "Smart Growth", we overwhelmingly mean "urban growth boundaries" or proxies for them, that DO drive land prices up. Once the land prices are driven up, "Spatial Distribution of Density" becomes DISTORTED in such a way that the outcomes are the OPPOSITE of what planners intended.
The point I am trying and trying to get across to architects, urban planners and planning students, is that the BIGGEST OBSTACLE to your ideals is INFLATED LAND PRICES; it forces you to cut corners in the cost of your structures that you will not want to cut, and it drastically reduces the potential number of BUYERS for your finished homes and premises. You might be critical of some of the affordable new housing Hugh is referring to in North America, but I doubt you have had a close enough look at it. The low cost is 80% because of cheap land and 20% because of economies of scale; NOT because corners have been cut in design and construction. MUCH more corner-cutting will take place where the land is far too expensive; you actually end up with a house nowhere near as good for double the price; THAT is what is happening in NZ.
IF you end up putting your high density ideas into practice way out at the urban fringe because that is where the land is "least unaffordable" (it is still wrong to call it "affordable"), THAT is why the "Density Gradient" Bertaud refers to gets "flipped" in the wrong direction. There must be hardly a more fun place to be an architect/neighbourhood planner than in the cheap land markets in the USA that you are mistakenly sneering at. You do not have your hands tied by the need to trade off design and construction costs to ameliorate land cost. Houston et al do not LACK beautiful, funky, progressive buildings and neighbourhoods, far from it.
Please tell me you understand this, there is NOTHING more important than this, for anybody who wants to "make an impact" for the BETTER, on contemporary urban planning. If you do follow and agree, I hope you make waves in your chosen profession eventually. Otherwise we will continue our trend to "even worse housing than Britain".
Bernard
The addition of a thumbs down would add credenceand perspective to the thumbs ups, don't you think? I believe it would certainly make this aspect of the site more relevent and popular.
Otherwise your readers are tempted to write comments in the heat of the moment that maybe they would have refrained from if they'd had a more simple and prompt way to voice their displeasure. I note that despite your entreaties to the contrary, readers are resorting to personal attack on occasion.
Can't have it both ways. Either allow open slather, or make good your threats to deregister, or let Wolly's peasants (myself included) let off steam. You've got kids, haven't you?
Looks like a dead thread but interested to hear peoples thoughts…
I think it’s obvious that a fair proportion of New Zealanders are condemned to being a generation of renters. However, they have options…EDUCATION! The only way to increase your earning potential (assuming you are not an entrepreneur) is to up skill. Don’t rely on wages catching up – you’ll still get paid rubbish for doing the same old thing in the future.
Increase your earning potential by investing in your education…don’t listen to Wolly. Acquire tradable and sought after skills. For the ones who put in the effort this will equate to higher salaries and good opportunities. If they don’t exist in New Zealand at the time, then they certainly will in the global market place. Choose your profession wisely and wake up to the fact that there is a world outside the borders of our fair country. Earn and come back. Before anyone says that the world is stuffed and there are no opportunities, look again - there are always hot spots.
Work hard, get promoted or look and move for good opportunities and save, save and save. One day you’ll be able to enter the market or invest in profitable sectors of the economy. It takes HARD work, some more HARD work, THOUGHT, PATIENCE and TIME. These are things that seem to be in short supply these days.
The other option is to do nothing and condemn yourself to poverty, MOAN, put your hand out, wait for an inheritance (if you’re that lucky) or grow vegetables (sorry Wolly, stole this idea of you mate) in the back yard of your rental, cross your fingers and hope for the best. Don’t trust or wait for the government or anyone else to do it for you, you’ll be very disappointed! Get EDUCATED and try and get ahead.
Nothing visionary in these comments granted, but I don’t see this being discussed. Millions of poor Indians and Chinese have figured it out - do everything they can to educate their young, or themselves and ensure that the next generation is better of than the last.
We welcome your comments below. If you are not already registered, please register to comment
Remember we welcome robust, respectful and insightful debate. We don't welcome abusive or defamatory comments and will de-register those repeatedly making such comments. Our current comment policy is here.