
By Bernard Hickey
Lower interest rates and flat to lower house prices helped improve home loan affordability in 21 out of 24 of areas surveyed across New Zealand in March, the Roost Home Loan Affordability report shows.
A loosening of lending criteria and more intense competition for mortgage lending by the banks is also making it easier for first home buyers to get into the market, the report found.
Only Auckland Central, Tauranga and Kapiti Coast saw their home loan affordability measures deteriorate as house prices rose significantly in those areas, overwhelming the positive effects of the March 10 floating mortgage rate cuts after the Reserve Bank’s monetary policy loosening.
There were renewed signs of a two speed housing market across New Zealand in March. Higher priced properties in Auckland and some wealthier resort areas saw increased activity and prices, while provincial cities, Christchurch and the fringe areas of large cities experienced flat to falling prices.
First home buyer affordability continued to improve to its best levels in seven years as flat to lower prices for entry level homes and the mid-March mortgage rate cuts combined to reduce mortgage servicing costs as a percentage of after-tax income.
There are also fresh signs that some banks have relaxed lending criteria and are offering discounts on legal and loan establishment fees.
Looser credit rules
“The banks are competing harder than ever for business, which is improving the prospects for first home buyers in particular,” said Rhonda Maxwell, spokeswoman for mortgage broking group Roost Home Loans.
Some banks are offering loan to value ratios of up to 90 and 95% and giving interest rate discounts when in competitive situations, Maxwell said.
“The increased willingness of some banks to go the extra mile with fee discounts and interest rate reductions is encouraging some new home buying,” Maxwell said.
A young couple earning the median wage could afford to buy a first quartile priced house in March, with 21.1% of their disposable income required to service an 80% mortgage. This is down from 21.6% in February and down from a June 2007 high of 35.1%.
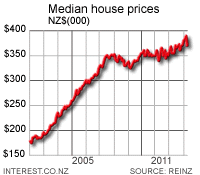 The national median house price rose to a record high NZ$365,000 in March from NZ$350,000 in February, but the first quartile house price was flatter at NZ$250,000 in March from NZ$245,000 in February. Prices outside of central Auckland, Tauranga and Kapiti Coast are flat to falling.
The Roost Home Loan Affordability report measures affordability nationally and regionally for individual income earners and households, taking into account median house prices, interest rates and incomes.
The Roost Home Loan Affordability measure for all of New Zealand showed the proportion of a single median after tax income needed to service an 80% mortgage on a median was 53.7% in March. This was better than the 54% seen at the end of February and the 83.4% seen at the peak of the boom in March 2008.
Affordability improved across 21 of the 24 areas surveyed. Central Auckland, Tauranga and Kapiti Coast affordability worsened because of house prices rises. Affordability improved dramatically in South Auckland, Whangarei, Rotorua, Gisborne, Napier, New Plymouth, Queenstown and Invercargill because of house prices being flat to falling while interest rates fell.
Affordability has been improving since December 2009 as house prices have flattened out and interest rates have fallen, the monthly measure calculated by interest.co.nz in association with Roost found.
Most borrowers floating
Most home owners are still on fixed mortgages, but more new borrowers are choosing to float, given floating rates at around 5.75% are cheaper than average longer term fixed rates at around 6.2%. Some borrowers are choosing to fix for shorter periods (6 months) where some rates are below 5.6%.
The Home Loan Affordability reports are now using the floating rate as most new mortgages are now floating rather than fixed. Home loan affordability hit its worst level of 83.4% in March 2008 just after house prices peaked and 2 year mortgage rates were close to 10%.
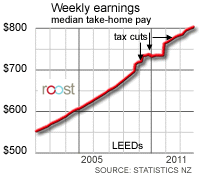 Affordability is difficult in Auckland, Wellington, Christchurch, Hamilton and Tauranga for those on a single median income, but homebuyers in smaller provincial cities will find home ownership much more affordable. Households with two incomes are also in a stronger position, particularly those bidding for homes priced in the lower quartile.
Affordability for households with more than one income improved slightly because of the fall in interest rates. This measure of a ‘standard typical household' found the proportion of after tax income needed to service the mortgage on a median house was to 35.3% at the end of March from 35.5% in December.
This measure assumes one median male income, half a median female income aged 30-35 and a 5 year old child that receives Working-for-Families benefits. Any level over 40% is considered unaffordable for a household, whereas any level closer to 30% has coincided with increased buyer demand in the past.
The survey’s measure of a ‘standard first-home-buyer household' found the proportion of after tax income needed to service the mortgage on a first quartile home fell to 21.1% in March from 21.6% in February.
This measure assumes a first home buyer household includes a median male income and a median female income aged 25-29 with no children. Any level over 30% is considered unaffordable in the longer term for such a household, while any level closer to 20% is seen as attractive and coinciding with strong demand.
Full regional reports are available below:
- New Zealand (159kb .pdf)
- Northland (159kb .pdf)
- Whangarei (159kb .pdf)
- Auckland region (159kb .pdf)
- Auckland Central (159kb .pdf)
- Auckland North Shore (159kb .pdf)
- Auckland South(159kb .pdf)
- Auckland West(159kb .pdf)
- Waikato and Bay of Plenty (159kb .pdf)
- Hamilton (159kb .pdf)
- Tauranga (159kb .pdf)
- Rotorua (159kb .pdf)
- Hawkes Bay and Gisborne (159kb .pdf)
- Napier (159kb .pdf)
- Hastings (159kb .pdf)
- Gisborne (159kb .pdf)
- Taranaki (159kb .pdf)
- New Plymouth (159kb .pdf)
- Manawatu and Wanganui(159kb .pdf)
- Palmerston North(159kb .pdf)
- Wanganui(159kb .pdf)
- Wellington region (159kb .pdf)
- Wellington City (159kb .pdf)
- Wellington Hutt Valley(159kb .pdf)
- Porirua (159kb .pdf)
- Kapiti Coast (159kb .pdf)
- Nelson and Marlborough (159kb .pdf)
- Nelson (159kb .pdf)
- Canterbury (156kb .pdf)
- Christchurch (156kb .pdf)
- Timaru (156kb .pdf)
- Central Otago Lakes (159kb .pdf)
- Queenstown (159kb .pdf)
- Otago (159kb .pdf)
- Dunedin (159kb .pdf)
- Southland (159kb .pdf)
- Invercargill (159kb .pdf)
| Regional home loan affordability comparison: | ||||||
| mortgage payment as a % of weekly take-home pay | ||||||
|
Mar-11
|
Feb-11
|
Mar-10
|
Mar-09
|
Mar-08
|
Mar-07
|
|
| New Zealand |
53.7%
|
54.0%
|
64.7%
|
55.7%
|
83.4%
|
78.8%
|
| Northland |
53.9%
|
55.5%
|
63.7%
|
56.4%
|
84.5%
|
75.9%
|
| - Whangarei |
41.7%
|
46.1%
|
54.4%
|
49.6%
|
73.5%
|
68.0%
|
| Auckland |
65.5%
|
67.9%
|
80.8%
|
68.2%
|
97.7%
|
94.8%
|
| - Central |
71.7%
|
67.3%
|
91.4%
|
71.0%
|
104.8%
|
105.6%
|
| - North Shore |
72.0%
|
73.3%
|
87.0%
|
70.8%
|
103.9%
|
99.5%
|
| - South |
64.4%
|
69.4%
|
78.0%
|
70.1%
|
93.1%
|
91.8%
|
| - West |
59.0%
|
59.5%
|
68.1%
|
58.1%
|
82.4%
|
80.4%
|
| Waikato/BOP |
47.8%
|
50.8%
|
61.5%
|
54.8%
|
80.8%
|
77.5%
|
| - Hamilton |
49.1%
|
52.4%
|
63.3%
|
56.3%
|
81.9%
|
81.7%
|
| - Tauranga |
58.6%
|
56.0%
|
71.8%
|
62.1%
|
89.2%
|
88.9%
|
| - Rotorua |
36.5%
|
41.3%
|
48.5%
|
44.2%
|
62.9%
|
58.9%
|
| Hawkes Bay |
43.1%
|
49.6%
|
55.0%
|
48.9%
|
71.3%
|
68.7%
|
| - Napier |
46.6%
|
54.3%
|
62.6%
|
54.2%
|
72.8%
|
73.1%
|
| - Hastings |
41.5%
|
50.5%
|
54.9%
|
49.6%
|
74.4%
|
67.3%
|
| - Gisborne |
41.1%
|
45.0%
|
56.2%
|
44.9%
|
67.8%
|
73.9%
|
| Manawatu/Wanganui |
34.7%
|
39.8%
|
45.2%
|
40.4%
|
58.6%
|
57.7%
|
| - Palmerston North |
38.9%
|
42.8%
|
50.0%
|
44.8%
|
70.2%
|
62.4%
|
| - Wanganui |
29.5%
|
38.2%
|
41.4%
|
31.1%
|
49.8%
|
51.6%
|
| Taranaki |
43.1%
|
47.6%
|
54.7%
|
46.3%
|
66.0%
|
65.4%
|
| - New Plymouth |
45.6%
|
53.1%
|
59.6%
|
55.5%
|
88.0%
|
80.3%
|
| Wellington region |
56.4%
|
58.2%
|
67.9%
|
57.8%
|
90.7%
|
79.8%
|
| - City |
57.9%
|
63.6%
|
71.5%
|
61.3%
|
91.6%
|
84.2%
|
| - Hutt Valley |
49.6%
|
50.4%
|
58.9%
|
49.9%
|
71.7%
|
67.5%
|
| - Porirua |
59.8%
|
62.2%
|
69.0%
|
56.6%
|
86.5%
|
87.6%
|
| - Kapiti Coast |
53.2%
|
52.3%
|
71.2%
|
53.9%
|
86.2%
|
76.7%
|
| Nelson/Marlborough |
53.1%
|
56.0%
|
66.7%
|
58.3%
|
82.5%
|
82.5%
|
| - Nelson |
53.2%
|
57.5%
|
64.8%
|
57.6%
|
78.8%
|
80.2%
|
| Canterbury/Westland |
44.0%
|
46.2%
|
56.8%
|
49.6%
|
77.1%
|
71.8%
|
| - Christchurch |
52.7%
|
54.6%
|
65.2%
|
54.3%
|
84.4%
|
82.1%
|
| - Timaru |
36.9%
|
38.0%
|
46.3%
|
41.0%
|
61.1%
|
54.2%
|
| Central Otago Lakes |
70.7%
|
73.1%
|
86.2%
|
77.8%
|
123.9%
|
102.9%
|
| - Queenstown |
82.3%
|
95.5%
|
100.7%
|
95.2%
|
126.6%
|
119.1%
|
| Otago |
34.4%
|
39.5%
|
45.5%
|
41.2%
|
62.2%
|
56.9%
|
| - Dunedin |
39.8%
|
44.1%
|
52.4%
|
46.0%
|
71.8%
|
65.1%
|
| Southland |
29.1%
|
34.5%
|
36.8%
|
32.4%
|
50.0%
|
39.4%
|
| - Invercargill |
31.9%
|
38.7%
|
38.7%
|
34.2%
|
57.5%
|
42.8%
|
No chart with that title exists.
We welcome your comments below. If you are not already registered, please register to comment
Remember we welcome robust, respectful and insightful debate. We don't welcome abusive or defamatory comments and will de-register those repeatedly making such comments. Our current comment policy is here.