
By David Chaston
House prices are rising again. At the same time, concerns about "affordability" are also rising.
Today, Demographia has released its annual international study comparing 337 urban markets, and highlighting that most of New Zealand's major urban markets are significantly unaffordable. (see links below).
Housing affordability has now crossed over to being a full political issue. Parties are issuing policy statements, and some have the issue as their main talking point. Newspapers run front page stories about it because it drives sales.
Clearly people are concerned - especially first-home buyers and families who feel they need to live within a sensible commuting distance from their work. In some of our major urban centres, this is now pretty tough.
Solutions proposed fall into two types: demand-focussed or supply-focussed.
Demand-focussed 'solutions' aim to change the ability of potential home-buyers to afford what is available, to try and help them "get on the property ladder".
Among solutions suggested include making available easier borrowing terms, lower deposits, low or concessional interest rates. Housing NZ's Welcome Home Loan program is an example. Being able to use some of your KiwiSaver as part of a first home house deposit is another. Some people often think that 'intensification' means lower house prices because they think multiple units on a standard block of land lowers the land costs.
Supply-focussed 'solutions' aim to address the fact that rising demand is not being met with rising supply and consequently 'price' becomes the market way to ration the demand.
Reversing these pressures requires many actions that result in building enough houses to meet demand requirements, or slightly more so that the pressure on prices abates or reverses. Intensification can play a part in this, but regulation inhibits any meaningful chance that 'houses' will be built - more likely they will be flats, apartments, and other shared-living dwellings or communities.
The risk of building 'shoebox ghettos' rises when the goal is affordability without a significant release of land supply.
How to define affordability?
But how should we define affordability?
The main way is to relate dwelling prices to incomes.
The house-price-to-income multiple is a simplified, yet internationally recognised measure of housing affordability. It is covered in Agenda 21, Chapter 7 of the United Nations Framework and it is defined as the ratio between median house price and median annual household income, otherwise known as the median multiple. The World Bank also says this ratio is "possibly the most important summary measure of housing market performance, indicating not only the degree to which housing is affordable by the population, but also the presence of market distortions".
Housing is considered "affordable" when it can be purchased for less than three times annual household incomes. It is "moderately unaffordable" at between three and four times household incomes, is "seriously unaffordable" between four and five times household incomes, and "severely unaffordable" above five times annual household incomes.
Unfortunately for us, we live in a region where prices have skyrocketed due to the regulatory strangling of new house building. Sydney is familiar to many New Zealanders; it is 'local', 'real' and one of the world's most expensive cities in which to buy a home. We forget how much of an outlier Sydney and Melbourne are. And Auckland has joined that outlier club.
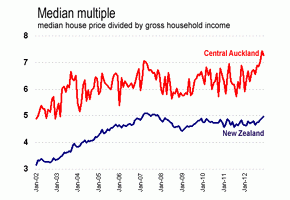
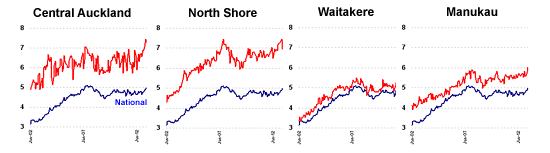
Based on our monitoring of prices and household incomes of the main house-buying demographic (30-35 year olds), there are now large parts of the residential belt in central Auckland where the median multiple is well over seven times, far above "severely unaffordable". Auckland's North Shore at almost at seven times, in Manukau its is rising in a worrying trend and has just touched six times, and out west in the Waitakere region of the city it is 5.5 times. All these are at record highs (that is record unaffordability) since we started monitoring median multiples in late 2001.
'Severely unaffordable'
Nationally, we are now back over five times and "severely unaffordable". The national record however was back in April 2007 and we are quickly getting back to that pressure.
In Christchurch, it is back up to 5.3 times, and close to its record high which was reached in 2007.
In Wellington City and in Porirua it is at a similar level of 5.3; it is about 4.5 on the Kapiti Coast, 4.2 in Lower Hutt and about four in Upper Hutt. In all these places it is "seriously unaffordable" to buy a house by international standards.
The places in New Zealand that are "affordable" and where you can find one for three times household income or less include Rotorua, Wanganui, and Invercargill.
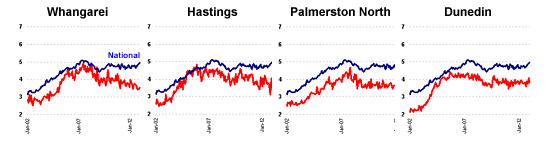
Places with a median multiple between 3x and 4x include Whangarei, Gisborne, Hastings, Palmerston North, Timaru and Dunedin.
Caveat
This analysis uses the international standards, and there is one caveat that is worth mentioning. There have been a series of tax cuts in New Zealand designed to boost take-home pay. The effect of tax cuts are not accounted for in the "median multiple" calculation because under that standard it is "gross household income" that is related to house prices. This is a flaw in the median multiple approach. Our Roost Home Loan Affordability series overcomes that problem by focussing on individual and household "take home pay" (ie: after-tax income). The downside of the Roost home loan affordability measure is that it is not internationally comparable.
That parts of the New Zealand housing markets are under stress is unarguable and obvious for a growing number of buyers and families that need somewhere decent to live within reasonable distance from their employment.
Unfortunately, the situation has been developing since late 2002 - more than a decade - when the national median multiple was below 3.5 times. We are inured to the corrosive effects of unaffordable housing. If Auckland's median multiple fell from its present 7x to closer to 6x some official would declare victory. But it needs to return to the threes before a sustainable victory is claimed. That will require major actions mostly at the local level by local authority and city officials.
In Auckland where the severest issues are, little but platitudes are being expressed. There is certainly zero commitment to take meaningful action. Large landbankers help finance mayoral campaigns and high property values are required to justify rates for urban train ambitions. Besides, most politicians believe that they would pay with their jobs if the value of voters' "investment" in their houses fell.
It may be too much to expect that after a decade of inaction that has caused the crisis, there would be a sudden epiphany.
Tax-free capital gains for those that have them are a powerful drug.
Pity our kids.
|
Updated 21 Jan 2013
|
Median
|
Median
|
----------------Median multiple----------------
|
||||||
| (see Notes here) |
Population
|
House price
|
H'hold Income
|
Demographia |
Dec-12
|
Nov-12
|
Oct-12
|
Dec-11
|
Dec-10
|
|
Jan-13E
|
Dec-12
|
Dec-12
|
Sep-12 | ||||||
|
|
|
|
|
|
|
|
|
||
| NZ total |
4,453,000
|
$389,000
|
$78,259 | 5.3 |
4.97
|
4.90
|
4.87
|
4.67
|
4.74
|
|
|
|
|
|
|
|
|
|||
| Whangarei District |
80,500
|
$267,000
|
$75,582 |
3.53
|
3.46
|
3.46
|
3.54
|
3.83
|
|
|
|
|
|
|
|
|
|
|||
| Auckland metro |
1,486,000
|
$535,000
|
$83,261 | 6.7 |
6.43
|
6.49
|
6.38
|
5.99
|
5.75
|
| - North Shore |
225,800
|
$614,360
|
$88,262 |
6.96
|
7.50
|
7.35
|
7.05
|
6.80
|
|
| - Waitakere |
204,500
|
$450,851
|
$81,738 |
5.52
|
5.45
|
5.42
|
5.16
|
4.80
|
|
| - Central |
444,100
|
$626,385
|
$86,088 |
7.28
|
7.44
|
7.06
|
6.64
|
6.47
|
|
| - Manukau |
368,500
|
$492,751
|
$77,606 |
6.03
|
5.79
|
5.60
|
5.51
|
5.55
|
|
|
|
|
|
|
|
|
|
|||
| Hamilton City |
145,600
|
$337,500
|
$77,753 | 4.7 |
4.34
|
4.30
|
4.36
|
4.47
|
4.41
|
|
|
|
|
|
|
|
|
|||
| Tauranga City |
115,700
|
$349,000
|
$75,941 | 5.9 |
4.60
|
4.52
|
4.40
|
4.28
|
5.24
|
|
|
|
|
|
|
|
|
|||
| Rotorua District |
68,900
|
$210,000
|
$77,526 |
2.71
|
2.80
|
3.10
|
3.23
|
2.98
|
|
|
|
|
|
|
|
|
|
|||
| Gisborne District |
46,600
|
$227,250
|
$70,052 |
3.24
|
3.62
|
3.36
|
3.31
|
3.34
|
|
|
|
|
|
|
|
|
|
|||
| Hastings District |
75,500
|
$312,500
|
$71,146 | 4.5 |
4.39
|
4.06
|
4.37
|
4.26
|
4.64
|
|
|
|
|
|
|
|
|
|||
| Napier City |
57,600
|
$249,000
|
$70,926 | 4.5 |
3.51
|
4.04
|
3.12
|
4.03
|
4.29
|
|
|
|
|
|
|
|
|
|||
| New Plymouth District |
73,800
|
$312,000
|
$71,821 |
4.34
|
4.32
|
4.52
|
4.21
|
4.71
|
|
|
|
|
|
|
|
|
|
|||
| Wanganui District |
43,500
|
$189,500
|
$68,457 |
2.77
|
2.44
|
2.71
|
2.54
|
2.66
|
|
|
|
|
|
|
|
|
|
|||
| Palmerston North City |
82,100
|
$265,500
|
$76,232 | 4.4 |
3.48
|
3.66
|
3.74
|
3.65
|
3.53
|
|
|
|
|
|
|
|
|
|||
| Wellington metro |
487,700
|
$407,500
|
$85,914 | 5.4 |
4.74
|
4.72
|
4.70
|
4.64
|
4.91
|
| - Kapiti Coast District |
48,900
|
$325,000
|
$75,175 |
4.32
|
4.66
|
4.38
|
4.76
|
4.91
|
|
| - Porirua City |
52,700
|
$437,263
|
$82,263 |
5.32
|
4.60
|
4.39
|
4.51
|
5.26
|
|
| - Upper Hutt City |
41,500
|
$334,000
|
$83,551 |
4.00
|
4.17
|
4.42
|
4.38
|
3.91
|
|
| - Lower Hutt City |
103,000
|
$356,000
|
$84,410 |
4.22
|
4.15
|
4.28
|
4.32
|
4.65
|
|
| - Wellington City |
200,100
|
$501,804
|
$95,579 |
5.25
|
5.38
|
5.33
|
5.29
|
5.55
|
|
|
|
|
|
|
|
|
|
|||
| Nelson City |
46,200
|
$359,000
|
$72,160 |
4.98
|
4.65
|
4.93
|
4.47
|
4.77
|
|
|
|
|
|
|
|
|
|
|||
| Christchurch City |
367,700
|
$398,528
|
$75,541 |
5.28
|
4.98
|
4.94
|
4.86
|
4.98
|
|
|
|
|
|
|
|
|
|
|||
| Timaru District |
44,700
|
$250,500
|
$70,575 |
3.55
|
3.39
|
3.22
|
3.63
|
3.22
|
|
|
|
|
|
|
|
|
|
|||
| Dunedin City |
126,000
|
$255,500
|
$67,077 | 5.1 |
3.81
|
4.10
|
3.75
|
3.89
|
3.89
|
|
|
|
|
|
|
|
|
|||
| Queenstown-Lakes District |
28,700
|
$568,000
|
$72,226 |
7.86
|
6.60
|
7.17
|
8.01
|
6.20
|
|
|
|
|
|
|
|
|
|
|||
| Invercargill City |
53,000
|
$170,000
|
$69,535 |
2.44
|
3.20
|
2.89
|
2.92
|
2.70
|
|
Today's release of the Demographia survey allows readers to compare data for 337 international metropolitan areas.
There is a difference between the interest.co.nz data and the Demographia data, but they are largely comparable.
Firstly, the Demographia New Zealand data is for September 2012 and uses the last census data and factors increases in from then. Unfortunately the last census in New Zealand was in 2006.
Secondly, Demographia uses median household income, a very wide definition that includes a mix of incomes from wages, benefits, dividends, interest, self-employed income, and other gains. It also includes all household age groups.
The interest.co.nz data specifically targets the main house-buying age group, 30-34 year olds.
You can read the 9th annual Demographia Report for September 2012 here »
We welcome your comments below. If you are not already registered, please register to comment
Remember we welcome robust, respectful and insightful debate. We don't welcome abusive or defamatory comments and will de-register those repeatedly making such comments. Our current comment policy is here.