

Over the past three years, median house prices in Auckland have risen +40% (from $600,000 at the end of 2013 to $840,000 at the end of 2016).
Over the same time frame, the median rent in Auckland for a 3 bedroom house has risen only +19.2%, or less than half the house price change (from $520/week at the end of 2013 to $620/week at the end of 2016)
Given Auckland's widely observed 'housing shortage', how can rents rise so much slower than house prices?
With home ownership rates falling, on the surface this seems to fly in the face of common sense.
So it is time to look at the underlying data of the overall Auckland housing market, with a special focus on tenure.
Unfortunately, the raw data is only available from the Census reviews, and they happen infrequently. Even Statistic's NZ's subnational data on households is infrequent, and when it is released, it is only their estimate based on the change trends they see in the census data.
But there may be another way to bring the Census data up to date.
What we know
As far as housing is concerned, there are only a few key data elements needed to make an update, and a couple of assumptions for which we can be pretty sure we can agree on.
Statistics NZ have published this Census data for Auckland:
| 2006 | 2013 | ||
| # | # | ||
| Owned or part-owned | 204,711 | 201,411 | |
| Held in a family trust | 52,791 | 67,533 | |
| Rented | 145,953 | 168,708 | |
| ----------- | ----------- | ||
| Total households declared | 403,455 | 437,652 | |
| 'not elsewhere included' | 30,851 | 31,851 | |
| Total Households | 434,265 | 469,503 | |
| Home ownership rate | 63.8% | 61.5% |
In that seven year period, the number of total households in Auckland grew by +35,238 or a bit over +1% per year.
But the number of households renting grew by +22,755 or +15.6% or more than +2% per year.
Essentially, housing was converted from 'owner-occupied' to 'rented'.
In the same period the volume of owner-occupied housing only grew by +4.4%, or 11,442 over the seven years. That is a remarkably low 1,635 per year.
Fast-rising rental supply kept a lid on rents. Conversely, slow-rising owner-occupied supply helped juice up prices.
Small-time property investors have been hard at work 'removing' owner-occupied housing from the market and adding it to the rental market.
In conjunction with strangled new build supply, this has had a distorting impact on both rents and house prices.
We can update this data to 2016
On an 'educated guess' basis we can update the 2013 Census data to 2016. Essentially, Auckland's housing supply is increased by the number of consented new residences issued. If we assume that it will take about a year to bring a 'consent' to occupation (and if we just ignore some minor practical details like housing demolition, and consents that never get built, and 'renovations' that end up as extra rented premises), we can expand the above table like this:
| 2006 | 2013 | 2016 | |
| # | # | #E | |
| Owned or part-owned | 204,711 | 201,411 | 203,475 |
| Held in a family trust | 52,791 | 67,533 | 73,000 |
| Rented | 145,953 | 168,708 | 184,317 |
| ----------- | ----------- | ----------- | |
| Total households declared | 403,455 | 437,652 | 460,792 |
| 'not elsewhere included' | 30,851 | 31,851 | 32,500 |
| Total Households | 434,265 | 469,503 | 493,292 |
| Home ownership rate | 63.8% | 61.5% | 60% |
23,140 residential building consents were issued in the years 2013, 2014 and 2015, and these are added above to give a total of 493,292 households at the end of 2016. Assumptions about the home ownership rate and the level of ownership in family trusts are estimates that allow us to complete the table.
That suggests the rate of conversion from owner-occupied to rentals actually picked up in the three years to 2016 to over +3% pa (half as much again as in the 2006-2013 period). And that supports the slowish rate of growth in house rents, while median house prices rose faster.
This conversion of owner-occupied to rental tenancy is one factor, albiet an important one, in why prices have risen so fast in the Queen City. Investor conversions are a significant part of the distortion in prices.
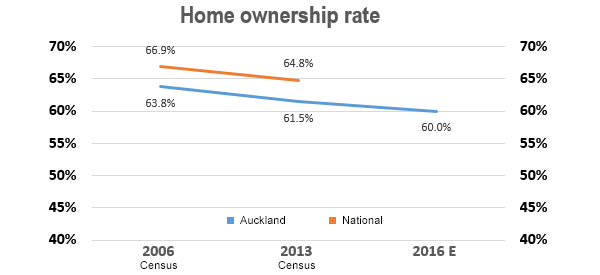
Auckland's home ownership rate has probably slipped below 60% about now.
Until now, renters have had the advantage of a relatively better deal for their housing costs. It has 'paid' to rent.
It is debatable about the overall social pressures renting is causing. Tenure issues are undoubtedly social pressure points, and as most residential landlords are amateurs, there is a lot of tenure risk renters assume.
But at the same time 'households' are forming later in life. The demand for owner-occupation may have been lower than a decade or three earlier. This is worth a read on the subject.
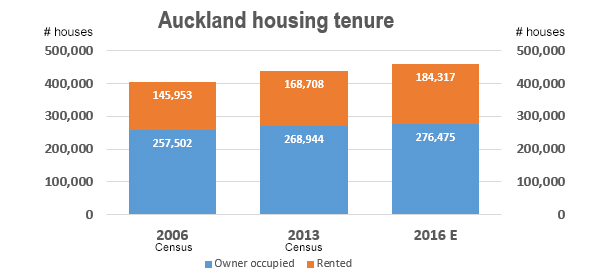
A serious increase in new house building is likely to keep a lid on overall Auckland house rents. But until latent demand is seen to be satisfied, it seems unlikely that it will depress house prices Christchurch-style. Only a sustained rise in supply over many years will do that.
No chart with that title exists.
We welcome your comments below. If you are not already registered, please register to comment
Remember we welcome robust, respectful and insightful debate. We don't welcome abusive or defamatory comments and will de-register those repeatedly making such comments. Our current comment policy is here.