

There've been a lot of retail interest rate changes recently; we have struggled to stay on top of them.
The flurry is probably not over with Wednesday's Reserve Bank (RBNZ) Official Cash Rate review upcoming and cuts a live possibility. We will have more on that on Sunday.
The changes have involved both home loans and term deposit (TD) offers, and the impetus has been led by the major banks who have had strong signals from wholesale interest rate markets, even if the RBNZ has not yet moved. Global financial markets are also on the move.
So it seems timely to take a break and assess whether any of the changes have got out of line. Have TD rates fallen faster than home loan rates, for example? Have banks used the noise to improve their margins? It's easy to be cynical and jump to conclusions that reinforce preconceived biases. But what is the evidence in the trenches?
We are in the middle of a general sinking of interest rates, so perhaps drawing conclusions now is a bit premature. Besides, individual bank rate setters not only respond to their cost of money, they also respond to loan demand, and to competitive pressures, all of which can be unforgiving.
So any analysis at this point is necessarily interim. We expect all the aforementioned forces still to be in play until well after the Wednesday RBNZ decisions.
With those caveats, here is where we stand at the end of trading Friday, August 9, comparing the current levels to a very arbitrary point at the start of the year. (There is nothing special about a January 2024 start point for this comparison).
| Carded rate offers | |||||||||
| 1yr fixed mortgage | 1yr Term deposit | Spread | |||||||
| 1-Jan-24 | 9-Aug-24 | change | 1-Jan-24 | 9-Aug-24 | change | 1-Jan-24 | 9-Aug-24 | ||
| % | % | bps | % | % | bps | bps | bps | ||
| ANZ | 7.39 | 6.85 | -54 | 6.10 | 5.60 | -50 | 129 | 125 | |
| ASB | 7.39 | 6.85 | -54 | 6.10 | 5.50 | -60 | 129 | 135 | |
| BNZ | 7.35 | 6.85 | -50 | 6.10 | 5.40 | -70 | 125 | 145 | |
| Kiwibank | 7.35 | 6.75 | -60 | 6.15 | 5.65 | -50 | 120 | 110 | |
| Westpac | 7.39 | 6.85 | -54 | 6.10 | 5.50 | -60 | 129 | 135 | |
| Ave main banks | 7.37 | 6.83 | -54 | 6.11 | 5.53 | -58 | 126 | 130 | |
| Cooperative | 7.30 | 6.79 | -51 | 6.20 | 5.65 | -55 | 110 | 114 | |
| Heartland | 6.99 | 6.69 | -30 | 6.30 | 5.80 | -50 | 69 | 89 | |
| SBS Bank | 7.55 | 6.85 | -70 | 6.15 | 5.80 | -35 | 140 | 105 | |
| TSB | 7.39 | 6.85 | -54 | 6.00 | 6.00 | 0 | 139 | 85 | |
| Selected others | 7.31 | 6.80 | -51 | 6.16 | 5.81 | -35 | 115 | 98 | |
The first point to note is the big banks as a group have hardly moved the spread between fixed home loan rates for one year and the equivalent term deposit offers. Of course, it will be less than in this table because borrowers are generally much more active in seeking and getting discounts from carded rates. This is a competitive pressure that is stronger when loan demand is weak. On the other hand, banks are very much less likely to offer 'better' term deposit rates - essentially for the same reason. So actual margins will be less than in the table.
The second point to note is rates are very volatile right now so what looks like a big move, such as for BNZ, will likely close up quickly.
The third point to note is challenger banks seem to be being squeezed. They are in an uncomfortable position, suffering narrower spreads and writing much smaller loan volumes. It's not a recipe for making market share gains from strength. And among the larger banks, it's Kiwibank that's in the tightest position on this front.
Differences from the start of the year are one thing. But how has the overall banking sector fared over the long run? How do current spreads compare since, say, the Global Financial Crisis?
The basic answer is they have been in a long-term narrowing trend.
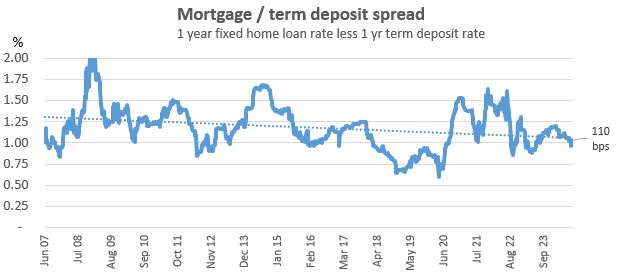
This chart tracking is actually measuring things slightly differently to the table above. It uses simple averages of all banks, not just the ones in the above table. And some small outlier banks often have uncompetitive rates for longish periods. And some banks come and go. HSBC as a retail bank is no longer active. Heartland and others have arrived over the longer period of the chart.
But even with those caveats, it is clear that bank margins are thinning. That is not so tough on the banks doing high volumes of transactions but it is very tough on those not.
So, now when we draw 'conclusions' about bank margins, we have some recent and long-term data to base them on.
For example, if you were a shareholder in Kiwibank, would you risk substantially more capital into a sector where margins seem to be shrinking in the business lines you need to grow, like retail mortgages? Especially when you know your four larger competitors are going to fight to hold or grow their share anyway?
We welcome your comments below. If you are not already registered, please register to comment
Remember we welcome robust, respectful and insightful debate. We don't welcome abusive or defamatory comments and will de-register those repeatedly making such comments. Our current comment policy is here.