

New research by the Reserve Bank (RBNZ) recommends switching up how it monitors inflation pressure in the labour market and communicates it to the public.
In an analytical note published on Monday, analyst Christopher Ball said the central bank shold be using four new measures for a real-time assessment of whether labour market tightness is driving inflation.
These are the job transition rate, the ratio of vacancies to unemployment, the unemployment rate, and survey questions about whether businesses have enough staff.
While the RBNZ no longer has an employment target as part of its monetary policy mandate, the central bank still pays close attention to the labour market.
Ball says employment is “an important consideration” when assessing the economy and that the updated remit includes avoiding “unnecessary instability” in employment.
“We continue to study labour market indicators as they provide useful insights on domestic inflationary pressure, volatility in the real economy and the transmission of monetary policy”.
When the Reserve Bank did have an employment target in its remit, it self-defined it as being the lowest level of unemployment that could be maintained without causing inflation. This level could never be known exactly and could move higher or lower depending on government policies and economic conditions.
New measures
Ball says many of the labour market indicators which have been used previously have performed poorly in the volatile pandemic years.
There are 44 indicators the RBNZ has been using to assess labour market tightness but some are given more weight than others.
A 2019 analytical note suggested focusing on the Māori and youth unemployment rates, underutilisation, the job finding rate, and the gap between unemployment and the trend.
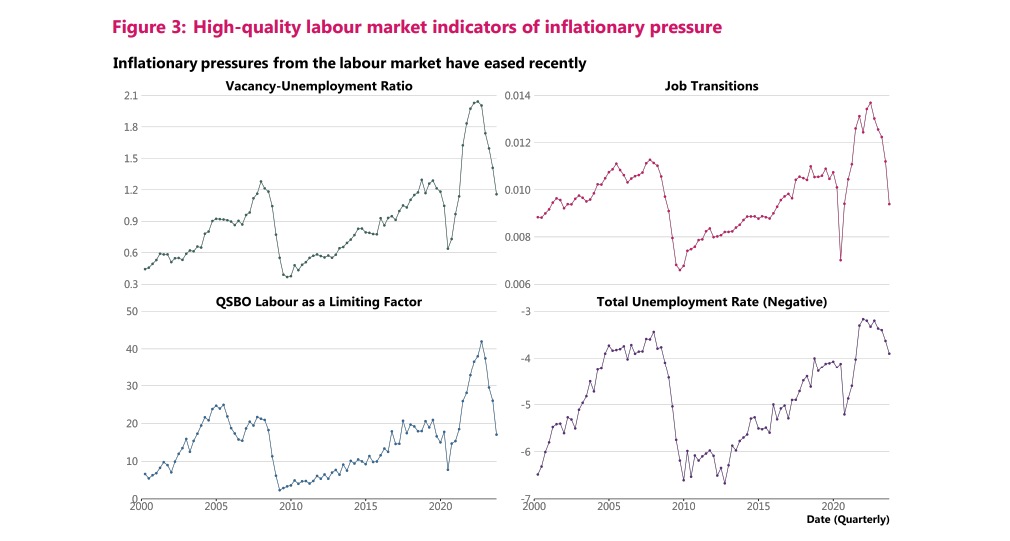
But Ball’s updated research finds a different set of indicators ae more closely correlated with the output gap and have the strongest causal links with inflation.
- The job transition rate, or how many workers are changing jobs.
- Responses to NZIER’s Quarterly Survey of Business Opinion question about whether the availability of workers is limiting businesses’ output
- The ratio of job vacancies to unemployed people
- And the headline unemployment rate
Ball says the unemployment rate itself is not as useful for determining inflation pressure as the other three measures but it should be kept for communication reasons.
“The unemployment rate is suggested as one of the high-quality variables because it remains central to the Reserve Bank’s monetary policy communication on the labour market, in large part because it is an economic variable well-known by the public,” he writes.
It's also one of the few labour market indicators forecast by economists and is “critical” for demonstrating how the Monetary Policy Committee moved the economy.
Policymakers should still use the full list of employment indicators when analysing the economy, but they should emphasise the most useful ones in their communications.
Ball suggests monetary policy statements should include a time series graph of the four highest-quality indicators and a heat map of the top 20.
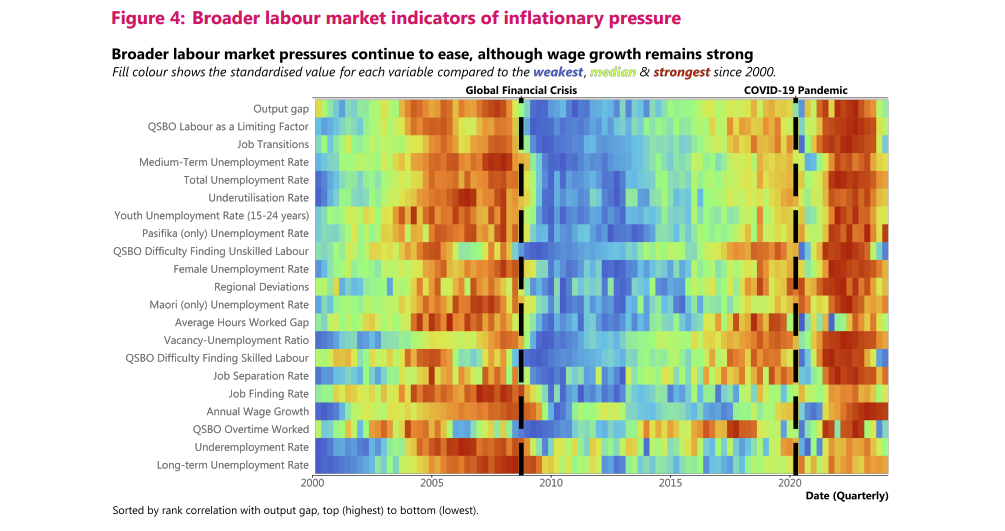
The current dot-plot style graph could be misleading for non-expert audiences who weren’t familiar with the historical context of the labour market.
“The suggested approach is to focus on a narrow set of four high quality indicators of inflationary pressure, while retaining the full set of existing indicators for understanding the broad context of the labour market,” Bell says.
15 Comments
There are contractors being laid off all over the place, many have enough cash they may not register for benefits , these are the hidden unemployed. My guess is at the moment its dozens a day, and its across Gov and private, going to be so many looking for so few jobs.
Things have changed a lot in the last 2 months. Maybe Nationals cuts have made it acceptable to ruthlessly review staffing.
A lot of places have overstaffed over COVID, while at the same time margins have dropped for some, as well as volumes.
It was always going to happen.
I'm still hoping to be made redundant. On the current trajectory, that might be happening sooner.
I'm hoping to be made redundant too yet I am following the trend of my entire career which is being the last person holding the baby. Specialists leave and are not replaced. The complexity of my work increases as I take on the burden of tasks once done by specialists on a declining customer base. Thank goodness for Google and Copilot. In my 65th year now and 44 years with the same employer, having seen many waves of redundancies, company reorganisations and mergers. Somehow always survive, probably because I don't specialise. Same things repeating over and over.
How did Chris manage to cherry pick those 3 indicators?
It seems like I forgot to link the paper in the story! I’ll add one,
The process is a little complicated for my arts major brain but basically it said the best indicator of inflation was the output gap
but the output gap cannot be measured in real time, only once all the data is out
so he used some kind of model to see which of these measures best matched the historical output gap and therefore which will be most predictive of the current output
Lol, look at those labour market indicators - all displaying the classic COVID inverted heart-beart (sudden down, sudden up, back down again). So many of the key economics year-on-year charts display this pattern, which is primarily a function of 2020 (and 2021 in part) creating very low baseline positions, which then made the bounce back in 2022 look like 'boom time'
I am not saying that the economy didn't heat up in 2022 of course, but the bounce back effect was often under-played. And, as you can see from the charts, we are now seeing permanent scarring from an over-zealous clamp-down. We saw the same in 2009 and in 1991. I think 1991 is the more obvious precedent - that was the last time Govt went for austerity at the same time that private credit stopped flowing.
The concept of an overheated economy seems pretty weird to me in the first place. The real, productive economy - the one that creates goods and services that make our life better - is based on combining the physical inputs of labour, capital and land to produce output of goods and services. The potential of the economy is based on the most efficient possible use of those resources to produce those outputs - "overheating" implies we have exceeded that potential which seems bizarre - if we can make the inputs combine to produce output today, we can surely do that tomorrow too.
So what is an "overheated" economy? Is it one where the inputs are temporarily elevated to unsustainable levels (e.g. by coercion of workers?) Or is it some superlative level of efficiency that can only be achieved by the lubricating effect of unsustainable debt? I'm suspicious of either explanation. I suspect the reality is that it's never the real economy that "overheats" , it's the hologram economy of speculative manoeuvring that overheats, and then does its best to drag down the real economy with it when it collapses.
Or to put it another way - if the real economy had been overheating, how on earth could we have ended up with our unprecedented trade deficits?
Good questions. I don't think the economy was *over*-heating - people who normally get overlooked for jobs were finding jobs. This is an unequivocally good thing!! We should have work for everyone that wants it
Our challenge is that when our economy runs hotter, people consume more, and, in NZ, this means we start to blow out our trade deficit - importing lots of expensive techy toys. To counter this we need policies to internalise demand - so that a hotter economy becomes self-generating. We used to understand this and we used to customs and tax settings to support our domestic economy. We have forgotten how
I think it's demand that overheats and thus supply can't keep up, causing inflation. Too many people having too much money. Higher for longer until enough people don't have enough money.
It's human nature.... the guys running rbnz and in govt watched the rest of the world lower rates and handing out cash... simply copied and somehow convinced each other this time it would never end. Demand caused local inflation, house prices and salaries soared as a result and we trashed the productive economy in favor of immigration and real estate.
But guess what.. not only did the boom end again BUT the downturn will be the inverse in time and depth to the upturn. It's simply the natural cycle of things and humans don't get to fight it and win.... so because we dragged the boom out so long and made it so high.. we are now in a heap of trouble.
Nz would be far better with a very conservative board at rbnz who don't get carried away with fads and copying others... but hold their nerve with a mid range rate.. and smooth out the peaks and troughs of the economy.
Similarly if we had a leader with big enough vision and character.. we could introduce CGT, smash the wastage and prioritize investment in export and value add business.
But.. I am not holding my breath with these populist landlords and bankers running the show
A 1991 style recession would blow Gen Z minds. I remember mass competition for jobs at a new chain restaurant paying $6.50 an hour. I was lucky or unlucky enough to get one.
It's coming.. the problem is that unskilled jobs will get terminated at a rate way faster than we churn out new citizens and immigrants. To get a job in fast food u will need to do it cheaper than a mass produced robot that makes no mistakes.
AI isn't a joke anymore.. the game for big business is now to hire smart kids to teach and develop AI to drive productivity and marketing in order to cut the cost of hiring unskilled . Because so many businesses are competing with different AIs they can't afford to slow for countries or people to catch up.
My own role is and business is shifting rapidly to focus on helping businesses work out jow to leverage AI and big budgets are available.
Watch this space and it's pace. It's frankly frightening.
Just in time for the 90 Day Hire & Fire Act kicks in next week.
NZs workforce has finally been casualised.
At least we are back on track and in good hands with a competent finance minister.
Finally got round to reading the RBNZ analysis...
Link: https://www.rbnz.govt.nz/-/media/project/sites/rbnz/files/research/asse…
The fact that the RBNZ is placing weight on the NZEIR Quarterly Survey of Business Opinion (QSBO) for "labour as a limiting factor" is greatly concerning.
Consider that Production = Land + Labor + Capital + Entrepreneurship.
Note: if Production is constrained, Prices can rise, i.e. inflation.
Thus for the same output (Production), one factor, say Labor, may reduce if one (or more) of the other factors increases, say Capital.
NZ Inc has a very real problem with productivity - it is way lower than our peers.
And one observation - confirmed by empirical studies - is that NZ Inc. has a lower employment of Capital than our peers. I.e. we instead increase one of the other three factors to increase production. And in NZ this is most usually Labor. i.e. "throw another body at the job".
Thus when the NZIER asks whether the supply of labor is "limiting production", it isn't getting much of an answer to anything as the other 3 factors need to be weighed at the same time.
But what is incredibly interesting is that is that when labor is in a sustained period of short supply, businesses in NZ tend to invest more Capital into production. Simple example: It would take six men three days to dig a ditch, but a digger and driver could do the same job in less than a day.
Thus - when labor is being reported as a ""limiting factor" it becomes a far less useful figure without knowing whether the use of Capital (e.g. buying a digger and training a driver) couldn't be used instead.
A further issue in NZ is that we need sustained periods of Labor being in short supply before NZ business managers (Entrepreneurship) get around to investing more Capital into the production process. One suggested reason for this is the boom/bust business cycle in NZ. (Looking at you RBNZ!)
Going back to our low productivity - a suggested reason - and one I believe is significant in NZ's economy - is that by raising the OCR the RBNZ creates a double whammy by:
1) driving people out of work which make Labor more abundant and constrains the price of Labor, while at the same time,
2) raising the cost of Capital (and the risk of using it when the RBNZ wants to create a Recession!) meaning it becomes more expensive (and risky) for businesses to adjust the parameters of Production equation by using more Capital.
At times when Business Opinion is reporting Labor is becoming a "limiting factor", the RBNZ should instead be looking at encouraging the use of Capital to increase Production to starve off Inflation. Do they do this? I've seen ZERO evidence!
So once again we can see that the OCR is a pretty hopeless tool as it simply embeds low productivity through low capital investment into NZ Inc. every time the RBNZ uses the OCR to lower inflation.
We welcome your comments below. If you are not already registered, please register to comment
Remember we welcome robust, respectful and insightful debate. We don't welcome abusive or defamatory comments and will de-register those repeatedly making such comments. Our current comment policy is here.