
This BNZ EcoPulse summary is re-posted here with permission.
Last Wednesday’s smaller-than-expected Q2 lift in the unemployment rate to 5.2% was, on the face of it, better news. But you didn’t have to scratch too far below the surface to reach the opposite conclusion.
Chiefly, unemployment would have lifted by more were it not for discouraged workers leaving the labour force. The labour force participation rate fell to a four-year low.
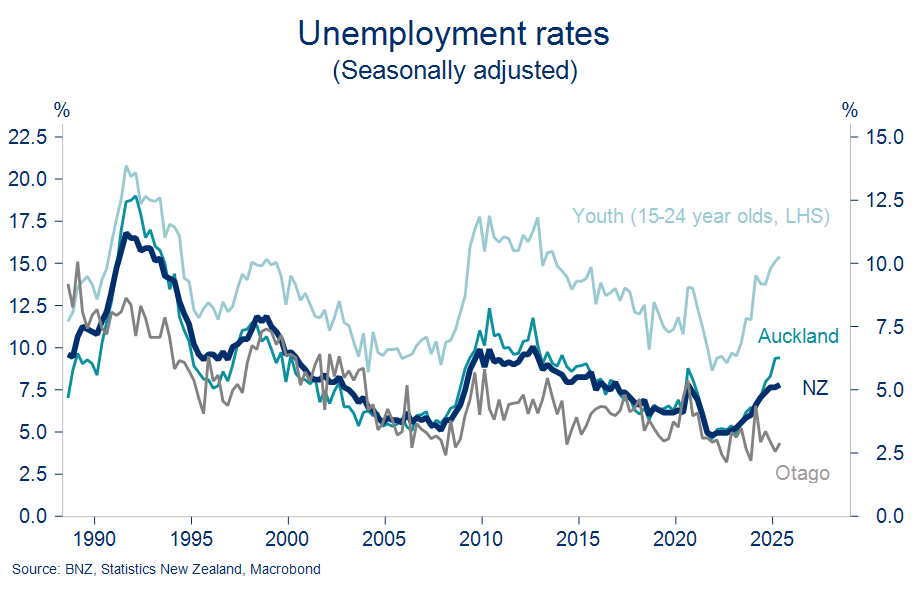
Youth unemployment and that of our largest city both hit highs not seen for more than 10 years. That’s even as Otago printed a jobless rate of 2.9% (all rates seasonally adjusted). It’s but the latest example of the southern outperformance story we’ve been running with for 18 months now.
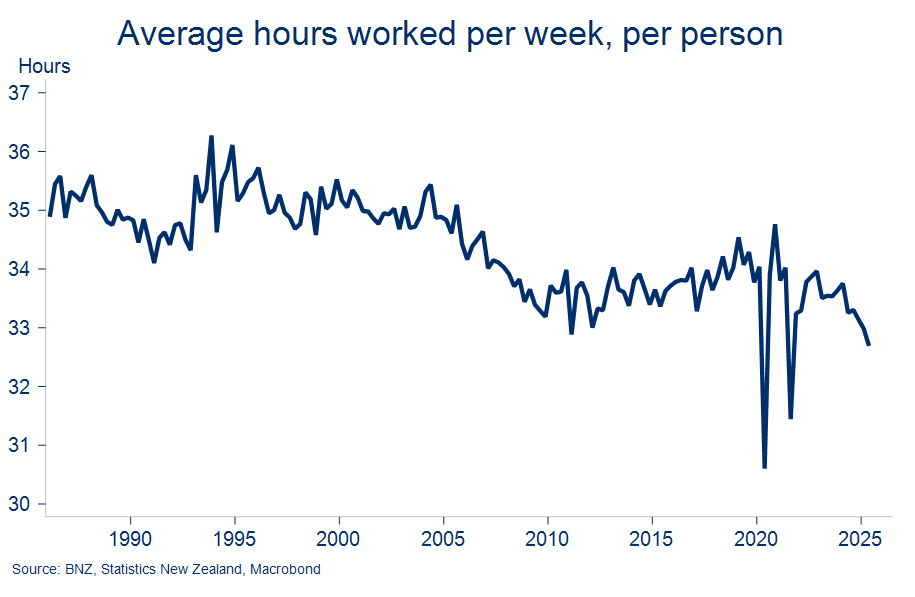
One of the more obscure stats we’re still digesting is the fact average hours worked per person, per week fell to the lowest level on record, excluding COVID-era volatility. It’s not necessarily an ominous sign as it could reflect a whole bunch of goings on. But it adds to the sense from other indicators that there’s heightened capacity even within the employed labour force. It could force additional layoffs should the work not start rolling in soon.
We think we’re edging towards the top of the unemployment cycle, but it still risks nudging a little higher yet. We’ve pencilled in a peak rate of 5.3%. A return to economic growth over the second half of this year, if realised, should bring some additional jobs with it, but probably not enough in our view to soak up expected growth in the population.
The key takeaway is that prospects for a sustained labour market recovery still look like a story for next year not this. That’s one of a few factors casting a pall over on the long-awaited lift in retail spending activity required to kick the broader recovery into gear.
Worth highlighting in this regard is that wage growth is coming off the boil at a time short-term inflation is going in the other direction. It’s eco-chat for the cost-of-living strains being widely felt. Most of the wage measures released in Q2 (and there are lots), showed the gap between wage growth and inflation being squeezed further.
Two of the better wage growth measures we’ll focus on here are, first, the Labour Cost Index (LCI), which is adjusted to reflect the cost of labour to complete a certain job to a consistent standard. It controls for the impact of the likes of promotions and productivity that are present in the second measure – the ‘unadjusted’ LCI. Basically, the first is a pure wage inflation measure, the second a closer approximation to the wage adjustments the average worker receives.
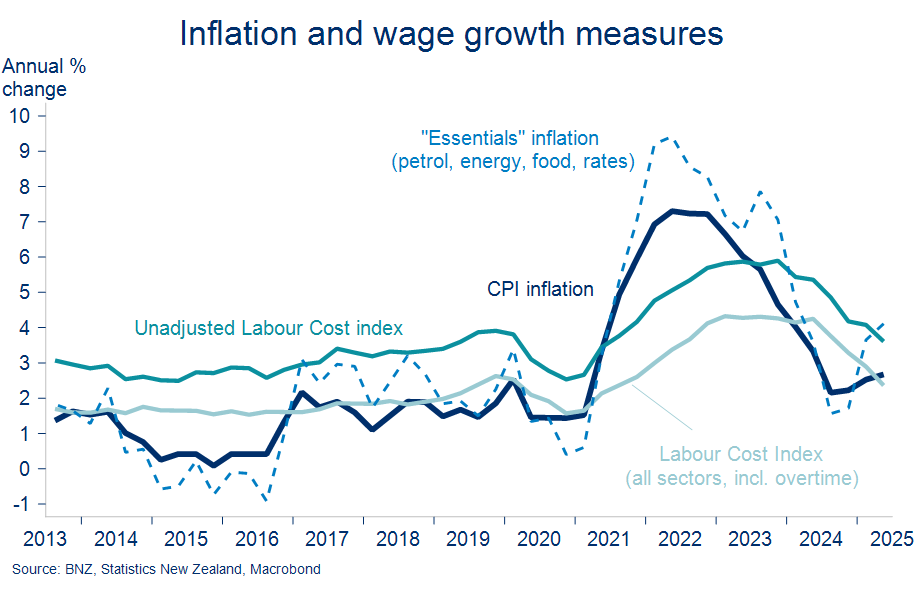
The decline in June quarter LCI wage inflation, to 2.4% y/y, means it is now back below the 2.7% annual inflation reported for the same quarter. That ends five quarters’ worth of modest inflation-adjusted wage gains.
The ‘unadjusted’ LCI suggests growth in worker compensation is still running ahead of inflation. Although, perhaps tellingly, not so a simple measure of ‘essentials’ inflation. Our approximation of the latter is based on petrol, energy, food, and rates.
Quarterly rates of change in prices and wages are one thing, but for the average consumer, the cumulative change over time probably matters more. The purchasing power lost in a bout of inflation can be felt long after said inflation has subsided.
Looking at ratios of wages to prices gives a sense of how the relativities have travelled over the past few years. The chart below indexes wage/price ratios back to 2017 levels.
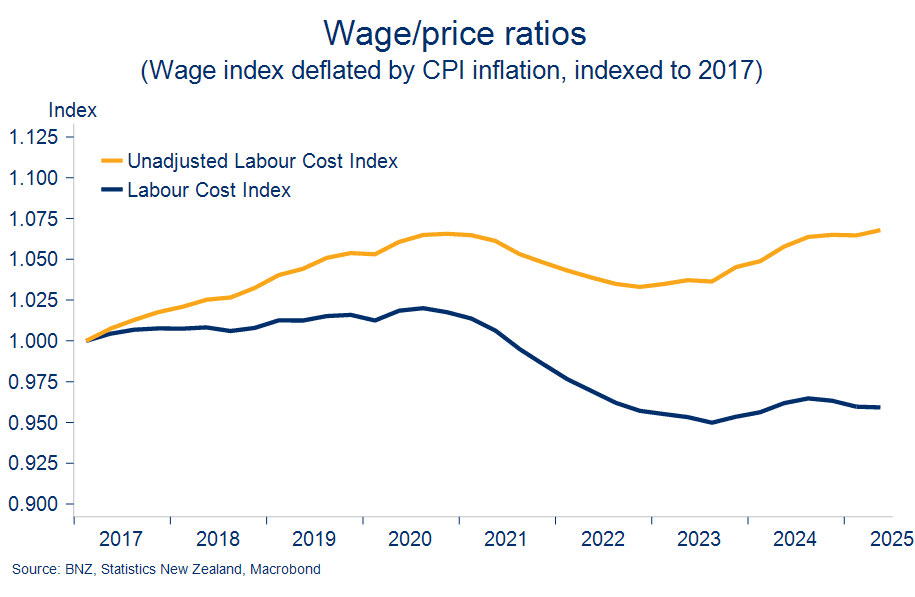
The inflation-adjusted (i.e. ‘real’) LCI wage index remains below where it was prior to the inflation spike of 2021/22. As noted earlier, this measure is more reflective of wage growth for a standardised job than that of an individual. The real ‘unadjusted’ LCI index – a measure more closely aligned to growth in labour earnings – has only just clawed its way back to where it was five years ago.
The flattish picture for aggregate real wage growth of course just formalises what’s been clear for consumers in the supermarket aisles or paying the bills for some time. There will also be a lot of demographic variation around these numbers. Such are the masking effects of top-line macro statistics.
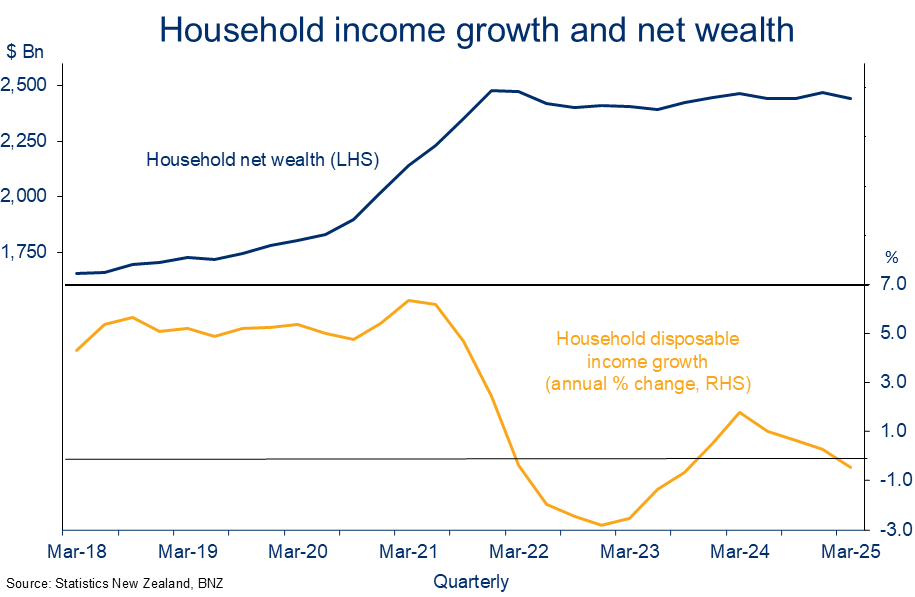
Wages are not the only way households can earn income or accumulate wealth. But when we pull in some of the broader trackers of such the above “flat” conclusion remains.
Stats NZ’s comprehensive but admittedly dated household disposable income figures show inflation-adjusted growth in all household income sources dipped back into the negative in March. We’d be surprised if the June quarter was any different. Meanwhile, household net wealth has flat-lined since late 2021 as the uplift from financial assets has been offset by non-financial (read: housing) assets.
Pulling all the threads together, it's not hard to see why household spending remains under strain. But what of the outlook?
In the short-term, it’s difficult to foresee much in the way of relief. Our forecasts are for wage growth to ease a little further, and for CPI inflation to rise to a peak of 3.0% in the third quarter. Combined, that’s clearly directionally unhelpful for inflation-adjusted incomes. It’s another headwind in behind the many others bearing down on retail spending.
The ‘good’ news, perhaps, is that consumer confidence is already so suppressed that additional compression in real wage growth may not impose any additional weight on spending appetites. That is, maybe consumers saw it coming? There’s a hint of this in the loose correlations in the chart below.
From the final quarter of this year some improvement in real wages is anticipated as the short-term spike up in inflation starts to unwind. The long-awaited cash release from the current period of mortgage re-fixing will also be providing some assistance.
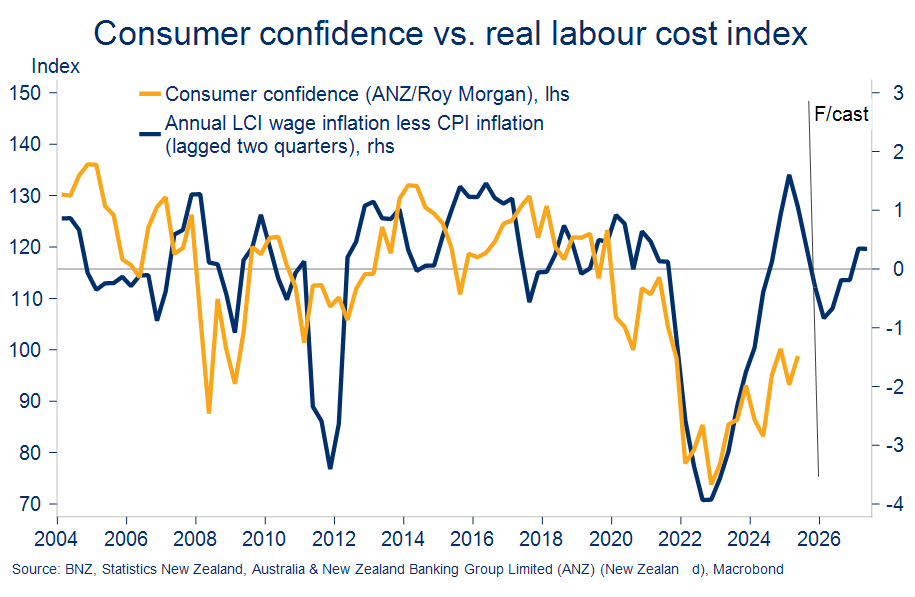
But we’re still left nursing continued downside risk on the lift in household spending that we (and others like the Reserve Bank) are forecasting for the coming 12 months. Certainly, consumer confidence needs to lift a long way from here for these forecasts to have any hope of panning out. The analysis above suggests that might take some time.
It's increasingly clear that the wobbling economic upturn needs a little more help from interest rates. We thus maintain our view that the Official Cash Rate will head sub-3% this year with 25bps cuts seen in both August and October. Markets are increasingly coming around to this view boosting the odds we see additional falls in short-term retail interest rates.
Mike Jones is the BNZ Chief Economist.
12 Comments
BNZ economist - in 2024 these were the guys predicting a 2025 recovery with 7% house price increases. What happened? How did they get it so wrong?
Sticking to the same old line - just waiting for interest rates to fall a little further to stimulate the economy. Yeah right.
"What happened" - the RBNZ chickened out. Small 0.25% OCR cuts with a pause won't get the economy back to where it was before they made continuous large OCR increases.
So no other reason you can think of that might have caused the NZ economy to collapse like a punctured lung in 2024?
So did Adrian Orr before he resigned.........
If hours worked per person are so low, the wealth effect is still stagnant, and wage vs. spending power is still likely to go lower before higher, what odds do you assign of a break-up in unemployment if firms "stop out" of hoarded labour?
This is good news for the government - downward pressure on wages and higher levels of unemployment will make NZ more attractive to foreign capital and will help to lift those business that are able to exploit a weak labor market to produce cheaper exports.
This is what I call 'Milei math' after the Argentine president - a weak domestic economy with high levels of unemployment and a falling currency can help deliver very attractive returns and even positive GDP numbers.
The Irish economy follows the same pattern with a total reliance on FDI and a poorly supported local population.
Stagflation. We are now paying for the excesses of Lab/Greens and Orr.
OCR @ 3.25% → even w/ 0.25 cut = 3% = 12x COVID emergency rate! = tight conditions. Real wages ↓ + unemployment ↑ 5.2% + youth jobless @ 10yr highs + record low hrs worked = deflationary spiral accelerating
12 times is quite harsh …..
Agreed. 12x is harsh. Even harsher on today's debt levels.
I think the RBNZ were hoping the fed had cut by now..... but tariffs have complicated things and fed in wait and see mode
Yep, classic fed pattern again. Late to raise, now late to cut. They never change?
But what is really wild is the fed is running at 87x their COVID lows. EIGHTY-SEVEN times! That has never happened in fed history. They are sitting super tight while worrying about tariff inflation? Meanwhile trade is about to collapse, company revenues will get crushed, unemployment will spike, and we will get deflation not inflation. They are fighting the wrong battle...again.
The fed will not be able to save everyone in the US when this hits, let alone anyone outside. Sure, they will wheel out the QE bazooka thinking "this will fix it!" Post-GFC they threw literal trillions at it and inflation barely moved. Now the hole is way bigger. Japan has been stuck in deflation for 3 decades despite unlimited QE, but somehow this time will be different?
Meanwhile our RBNZ has been building their war chest. Over $25 billion now for fx intervention. Reckon they are preparing for when the Kiwi really tanks? Another 2000 repeat with the dollar hitting 39 cents? or lower? They know what is coming. At least someone is actually preparing instead of just hoping for the best.
The fed is fighting yesterday's war while tomorrow's crisis is already brewing. Same old story really.
We welcome your comments below. If you are not already registered, please register to comment
Remember we welcome robust, respectful and insightful debate. We don't welcome abusive or defamatory comments and will de-register those repeatedly making such comments. Our current comment policy is here.