

With the introduction of the KiwiFund bill to Parliament, that culminates a period of public discussion around the level of fees charged for KiwiSaver funds. It builds on a theme promoted by Sorted, and marketing by Simplicity.
The regulator, the FMA, also highlights the impact of fees on returns in its KiwiSaver Tracker tool.
And with ANZ and Kiwi Wealth cutting back fees on their default funds recently, that appears to justify the criticism.
There is no doubt that the international literature generally supports the notion that high fees inhibit the growth of members' balances.
But most of that literature is based on the 10,000 fund-plus US market, the world's deepest managed fund market and one that has been studied academically for decades.
The New Zealand market is nothing like that. With less than 200 KiwiSaver funds, is it valid to use the US conclusions here?
Now that KiwiSaver has been going for 10 years, we probably do have a track record to test.
As readers will know, we track KiwiSaver fund returns on a 'regular savings' basis and have done so since March 2008. It involves a life-cycle approach, mimicking the way a member has built their contribution, and how returns have built up over the business cycle as it has played out over the past ten years. It is quite a different approach to the fund industry's point-to-point analysis (and one supported by the regulator, the FMA).
However, for this analysis, we have looked at what the fees were for each fund in 2017 on an equalised basis (that is, equalised with the same contribution level for all even though not all funds have been going since 2008). We have excluded funds that have not been going for at least three years, principally because we could not test our results on both a since-inception basis, and a last-three-years basis, which we like to do to be sure that results are not being skewed by some resting on earlier laurels.
First we looked at Default funds. The chart plots the 2017 fees (member scheme fees plus fund operating fees) and returns on an after-tax, after-all-fees basis.
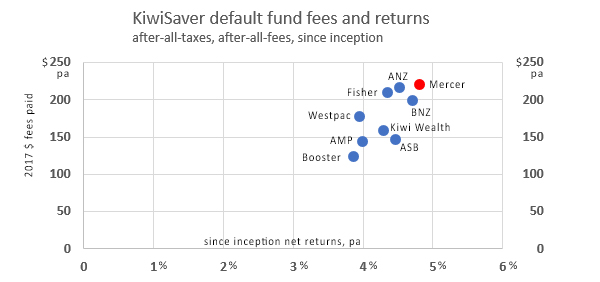
This produces a somewhat surprising result. Rather than 'proving' that high fees result in low returns, it suggests quite strongly the opposite. For the technically minded, the statistical correlation of high-fees-give-high-results (low-fees-give-low-results) is a notable 0.7. But we don't think you should jump to any conclusions about that; the sample is a tiny nine funds and both the returns and annual fee amounts are actually tightly bunched. (And when shifted to the last-three-years basis that correlation changes to 0.2.)
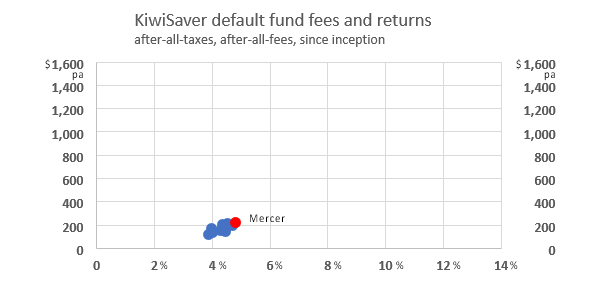
A better way to look at these Default funds is in the perspective of all KiwiSaver funds, like this:
The other risk categories reveal a wider and more random set of results.
For Conservative funds, you can pay over $600 in fees per year and get slightly better than average results (remember, these are 10 year results on an average per annum basis). Or you can pay mid $300 per year and would have got outstanding results from one particular conservative fund, even better than any default fund and well worth the $100 or so that a default fund would have saved you in fees.
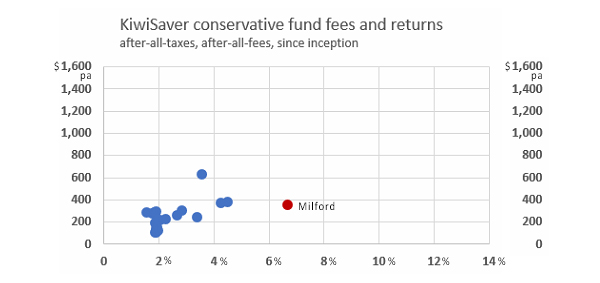
Among Conservative funds, there is a weak relationship between high fees and high returns.
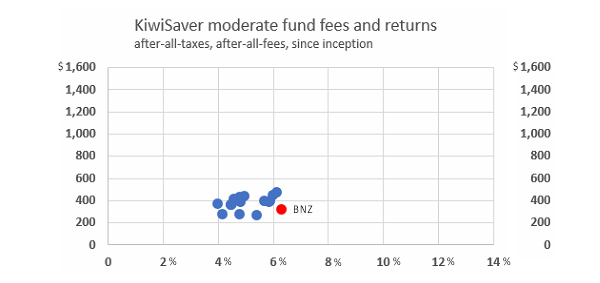
For Moderate funds, it is clear that fee levels have little relationship to long term fund returns.
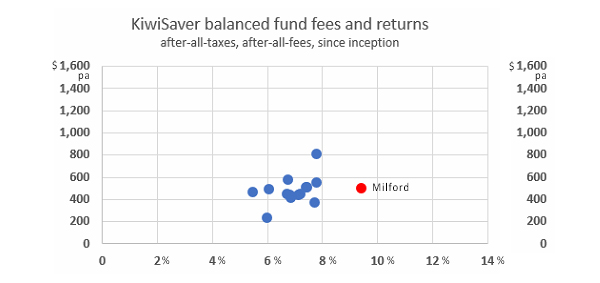
And that is equally true of Balanced Growth funds as well. Yes, you can choose a low-fee fund, but that hasn't resulted in higher-than-average returns for this category. Equally, higher fees may or may not result in higher long-term returns. There is little correlation.
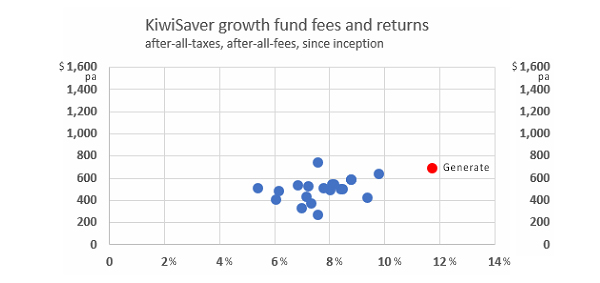
There is no practical correlation among Growth funds either.
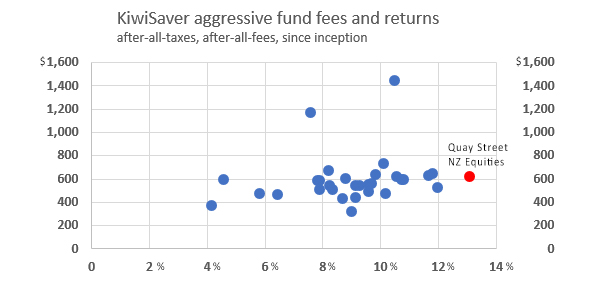
And the category with the most funds, the Aggressive fund risk category, shows a particularly wide and random pattern. Choosing a fund based on fees here in the expectation that long term results will be improved would have been a very poor decision. And it would have been equally poor to assume that higher fees would have resulted in out-sized returns.
The bottom line is that you are wasting your time in the thought that fees are some sort of indicator of long term fund performance. For New Zealand KiwiSaver funds it is a false lead, a dry hole.
The link between fees and results is either just easy marketing to naive consumers, or superficial analysis by politicians.
If there is any even weak correlation, it is that low fees tend to result in low returns, but even that suggestion is not a slam dunk.
Public policy makers should be looking at other factors for outstanding fund management and results.
Professional fund managers know this. They are prepared to pay for enhanced long term results. But they don't use the amount of the fees as the indicator.
You shouldn't either.
20 Comments
"The link between fees and results is either just easy marketing to naive consumers, or superficial analysis by politicians."
I think you are missing the point. Higher fees is meant to lead to higher returns (or at least that is what the providers are pedalling)
All the graphs above show that is clearly not the case. If fees are unrelated to return, as you have shown, then the consumer is probably best served by paying less fees.
You might have it backwards. If fees are no indication of results, then you should look for the best after-all-fees, after-all-taxes results irrespective of fees. You should be prepared to pay what you need to to get the best net outcome. 'Cheap' is not a real strategy.
Fees are actually a third-level consideration. First level is management capability to generate superior future returns (this is what professional fund managers focus on). Second level is the track record of net returns (after-fees, after-tax).
I agree with the best net outcome. However would add...
Past results are no indication of future returns. The fees however are known, and can be controlled.
Also, as the article states, we know the fees are a major factor globally. Why would be any different?
We are different because our market is small and very inefficient.
The article does not go into how and why we would differ.
How does being small mean our fees are unrelated to performance?
How does being ineffective mean that more fees = more returns?
How does being small and ineffective protect us from a downturn where returns plummet and then we pay outrageous fees on top?
The articles merely shows no relation between fees and performance. i.e. why pay more for the same result?
I would also add, that mitigating expenses is also a key investment strategy. Something that in a small inefficient market makes a lot more sense.
Kiwisaver has been a godsend for the funds managers, especially banks for the last decade, in view of the shrinking interest rates margins on loans and the ups and downs of the lending market. If an analysis is made as to how much the net profit of each bank is accounted for by the Kiwisaver fees, that will show the real position of how the Banks are being helped by Kiwisaver funds.
Don't forget risk and investment portfolios. Many can have higher fees based on higher risks and more active management versus sitting on cash investments & an index or two. Risk, diversification, management requirements, fees, performance etc all tangle together. Picking out two without identifying the other factors is intentionally misrepresenting data. Hence you do not directly compare a growth fund & conservative fund by performance alone, (or even two growth funds from different providers by performance alone), as the investment diversification & management can differ and affect the risk. The categories themselves describe the inherent risk and likely investments. Drilling further down into risk, diversification, management, fees & performance gives you an idea on which provider is better. But it can be just as likely one provider is better in performance for more conservative investments one year (which can have lower fees) than a growth fund due to those inherent risks being realised. Put simply, "you pays your money and you takes your chances". During the early Kiwisaver years we have had financial crises, earthquakes, & financial companies and insurers fail. Hence people looking at retirement in a short time frame would intentionally pick the lower performance low risk investments that can require less management because they are less likely to lose a significant chunk & have less time to make it back on further long term investing. Looking at just fees & performance may make more sense for them because the risks across most the conservative investments is smaller and they are less likely to diverge in downturns. But for those with growth funds knowing intimately the % investments can be important even during smaller crash periods.
On behalf of Simplicity, we agree entirely with Noncents and would add the following:
If international literature (not just U.S.) supports the notion that high fees inhibit the growth of members’ balances, why is that not relevant to New Zealand?
Just because there are only 200 or so KiwiSaver funds, does that mean it is OK for them to charge high fees?
When we get to the numbers, the limited sample size makes any analysis difficult, but the point is that all KiwiSaver managers in the survey are charging high fees. There is no “low fee” provider in the analysis, so how can you conclude fees do not matter? If the conclusion is that fees and returns are uncorrelated, surely you should minimise the factor that you can control.
There is almost an aside at the end of the article, suggesting that “professional fund managers” are “prepared to pay for enhanced long-term results” but do not use fees as the indicator. The level of fees has always been a key consideration in any RFP for an institutional mandate that we have been involved with; in some cases it has been the primary consideration. We'd be interested to see the evidence that the author has for that statement.
Appreciating the fact that you admit to excluding Simplicity from your data sample on the basis we haven't been running since inception, your argument would have had more credible if you'd included at least one fund manager that actually does charge substantially lower fees or made one up using hypothetical data.
I guess the proof will be in another 8 years if you want to wait that long to test the theory in the NZ context. When Warren Buffett issued this challenge, the only active manager to take the bait, threw in the towel before the deadline.
The article is a vaguely veiled criticism of Simplicity and what we are trying to achieve. By our estimates, we are already saving our 12,000 plus members more than $3.8 m p.a, in fees. Donating more than $160K to charity as well under our nonprofit model.
Our KiwiSaver fees clock (link below) should prove what a gravy train this business is.
https://simplicity.kiwi/#fees-clock
Challenge: How about you invite an active fund manager of your choice to come in and debate this issue with Simplicity on camera. Great entertainment for your readers no doubt.
The Team at Simplicity
Nice. Hope the yoga is still going strong.
Cheers. Yoga is a joy.
i agree thats why i am with simplicity:)
Hi David - interesting article and analysis. Would it be possible to compare performance over, say, a 10 year period? I.e. do some firms with higher fees consistently outperform over the long term?
A one off sample (i.e. 2017 only) could be like picking tickets from a hat....and trends may only present themselves over time..skill/expertise vs luck
The above analysis is over a ten year period. We also checked the data over the latest three year period as well. While it doies vary, the differences don't undermine the base ten year analysis.
To be clear, the net after-all-fees, after-all-tax returns are the per annum equivalent for the full ten years. The fees are what our benchmark member would have paid in 2017.
Good work David - thanks.
Nice, so this is also including their performance during bad downturns like 2008-09 etc where certain differences between investments can dramatically affect the more average year on year performance? I guess since the cycle is expected to always crop up with a downturn every few years it would demonstrate how they would cover & make up for those expected periods. The difference in the aggressive funds is certainly wider and more noticeable but whether it was just because of the outlying years or the more likely performance would be interesting to know.
Thanks David and the Interest analysts for this report. The findings *are* counter-intuitive, which the most interesting research often is.
Of course, with a correlation we can't ascribe causal relationships between fees and performance, but it's possible that higher fees might mean more money to do research, which could potentially benefit actively-managed funds.
I would still tend to agree that lower fees are better where possible, unless a higher fee buys some kind of downturn protection (things like equity shorts, hedge fund strategies, allocations to commodities, or other strategies), or, as David argues in his reply to Noncents, a quality track record and competent management.
Pleasing to see interest.co again involved in investigative journalism. A trait sadly lacking in our national print press.
I don't suppose you could look into the superfund costs to compare with KiwiSaver. Only linking the two because the superfund seems to do so damn well with similar aims.
Great article – very helpful. Some observations and questions...
1. The returns (net of fees and expenses) appear to be normally distributed.
2. There appears to be no (or little) correlation between net returns and fees Question: This analysis averages the net returns over 10 years. Is this averaging concealing trends in the data? Because alternatively, you could look for a correlation between returns and fees at the end of each financial year! Also do some stats, perhaps a Pearson correlation test. This way you could include the funds that have only been around for a year or two. What would be really cool is the same graphs as above but done by year, with a slider showing year, and some summary stats.
3. Are there any other measurable features that these funds possess? For example: Combined salary of top three executives… ? anything that you could use to correlate to net return. (I guess the fund's name is a feature that you could use)
It would be interesting to see the fees to funds managed ratio (over a period of time, say last 5 years or so) and the investment returns under each scheme by each provider to see who is giving more bang for the buck paid....
Would also provide an idea of the competitiveness of different providers.
We welcome your comments below. If you are not already registered, please register to comment
Remember we welcome robust, respectful and insightful debate. We don't welcome abusive or defamatory comments and will de-register those repeatedly making such comments. Our current comment policy is here.