New Zealand home loan affordability improved marginally in May from April as house prices edged lower for the second month running, Interest.co.nz’s Home Loan Affordability report shows.
The weakness in house prices more than offset a slight rise in fixed mortgage rates. The opposing forces of falling house prices and rising interest rates look set to buffet home loan affordability in the coming months, particularly after the May 20 Budget revealed more details on the tax arrangements for property and the Reserve Bank began hiking interest rates on June 10.
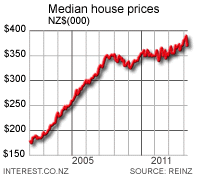
The national median house price fell 1.7% in May from April and was down 2.9% from a record high of NZ$360,500 in March. This more than compensated for the effects of a rise in the average 2 year fixed mortgage rate to 7.18% from 7.08% over the month.
The Reserve Bank increased the Official Cash Rate by 25 basis points to 2.75% on June, which triggered an increase in variable mortgage rates by ASB on June 17. ANZ and National followed with rate hikes on June 18.
Affordability improved slightly in the big cities of Auckland, Wellington, Christchurch, Dunedin and Hamilton, but worsened marginally in Northland, Hawkes Bay and the Central Otago regions.
Affordability is better than its worst levels hit in early 2007 near the peak of the housing boom and interest rates, but has broadly deteriorated in the last 12 months as house prices rebounded in the wake of interest rate cuts in late 2008 and early 2009,the monthly measure calculated by Interest.co.nz found. However the improvement in May and in April are the first two consecutive months of improvement in over a year.
![]() “Affordability has improved marginally in the autumn months because of a softening of house prices, but house prices remain broadly unaffordable for most income earners in the major cities,” said Interest.co.nz Editor Bernard Hickey.
“Affordability has improved marginally in the autumn months because of a softening of house prices, but house prices remain broadly unaffordable for most income earners in the major cities,” said Interest.co.nz Editor Bernard Hickey.
“However, there are signs of further downward pressure on house prices as the winter progresses, which may continue to offset the effects of likely increases in mortgage rates,” Hickey said.
The Budget on May 20, which included measures to discourage rental property investments, and the Reserve Bank’s monetary policy tightening on June 10, happened mostly after the data was collected for May.
“There is the potential for a significant hit to house prices which could improve affordability.”
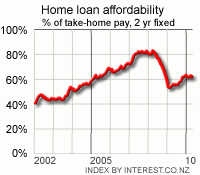
 The Home Loan Affordability measure for all of New Zealand showed the proportion of a single median after tax income needed to service an 80% mortgage on a median house fell to 61.4% in May from 62.0% in April and a 16 month high in March of 63.1%. This is the best level of affordability since September last year.
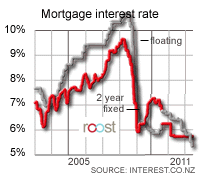
The median house price as measured by REINZ fell toNZ$350,000 in May from NZ$356,000 in April and a record high of NZ$360,500 in March. The average 2 year fixed mortgage rate, which has been among the most popular with borrowers in recent years, rose to 7.18% in May from 7.08% in April as expectations grew in wholesale interest rate markets about the likelihood of a Reserve Bank rate hike.
Variable mortgage rates, meanwhile, were flat at an average 5.86% in May and remain at their lowest level in at least 7 years, meaning some borrowers may choose to go variable rather than fixed to improve their immediate affordability. Variable rates are expected to rise to well over 6% by the end of 2010 and the Reserve Bank’s own forecast for 90 day bill rates suggest variable mortgage rates will hit 9% by the end of 2012.
Not as bad as it was
Affordability hit its worst level of 83.4% in March 2008 just after house prices peaked and 2 year mortgage rates were close to 10%. Many home buyers jumped in March, April and May of 2009 to take advantage of lower interest rates and look for bargains, which improved the number of houses sold and boosted prices. But short term mortgage interest rates flattened out in late March 2009 and longer term mortgage rates began to rise in line with rises on wholesale markets and higher local term deposit rates.
House sales volumes flattened off in the last three months of 2009 and early 2010 as first home buyers and rental investors stayed away, leaving most of the activity at the top end for owner-occupiers using equity stored up during the 2002-07 boom, or trading down to reduce debt. Volumes slumped in January and February sales were their lowest since REINZ records began in 1992. They recovered slightly in March, April and May, but remain 20% below previous year’s volumes.
 Affordability is now often out of reach for most home buyers in the big cities on a single income. The threshold proportion of after tax income considered prudent to sustainably own a house is around 40%. Anything above that is starting to become unaffordable. Affordability for the typical first-home-buyer also improved slightly in May from April.
The proportion of a single after tax pay needed to buy a first quartile house fell to 52.9% from 53.1% in April and 54.8% in March. The first quartile house price fell to NZ$249,000 from NZ$251,675 in April and NZ$257,500 in March. This measure is for a median income earner aged 25-29 buying a first quartile home. Interest.co.nz thinks the ‘affordable' threshold is 40% for such a home buyer.
Meanwhile, affordability for households with more than one income improved slightly to levels last seen at the end of 2008. This measure of a ‘standard typical household' found the proportion of after tax income needed to service the mortgage on a median house fell to 41.2% in May from 41.5% in April and 42.3% in March.
This measure assumes one median male income, half a median female income aged 30-35 and a 5 year old child that receives Working-for-Families benefits. This remains near the worst level of standard household affordability since November last year and significantly above the 35% trough seen in January, February and March of 2009, when buyer demand returned to the housing market. Any level over 40% is considered unaffordable for a household whereas any level closer to 30% has coincided with increased buyer demand.
Our measure of a ‘standard first-home-buyer household' found the proportion of after tax income needed to service the mortgage on a first quartile home fell to 25.5% in May from 25.6% in April. It has worsened from its best levels of 22% in February and March last year when some first-home-buyers returned to the market. This measure peaked at 35% in June 2007.
This measure assumes a first home buyer household includes a median male income and a median female income aged 25-29 with no children. Any level over 30% is considered unaffordable in the longer term for such a household, while any level closer to 20% is seen as attractive.
Southland remains the most affordable region for home buyers with a standard affordability measure of 37.4%, while the Central Otago Lakes (Wanaka and Queenstown) region is the least affordable on 81.6%.
| Regional home loan affordability comparison: | ||||||
| mortgage payment as a % of weekly take-home pay | ||||||
|
May-2010
|
May-2009
|
May-2008
|
May-2007
|
May-2006
|
May-2005
|
|
| New Zealand |
61.4%
|
55.5%
|
80.3%
|
80.8%
|
80.8%
|
67.4%
|
| Northland |
62.4%
|
55.2%
|
78.8%
|
82.4%
|
82.4%
|
69.0%
|
| Auckland |
75.0%
|
69.6%
|
97.5%
|
96.9%
|
96.9%
|
82.2%
|
| Waikato/BOP |
57.1%
|
54.5%
|
76.4%
|
76.8%
|
76.8%
|
66.1%
|
| Hawkes Bay |
53.8%
|
47.5%
|
69.1%
|
71.5%
|
71.5%
|
61.7%
|
| Manawatu/Wanganui |
42.7%
|
39.1%
|
57.0%
|
56.2%
|
56.2%
|
45.0%
|
| Taranaki |
52.2%
|
46.4%
|
72.3%
|
71.1%
|
71.1%
|
56.1%
|
| Wellington |
62.5%
|
57.9%
|
84.0%
|
82.6%
|
82.6%
|
64.7%
|
| Nelson/Marlborough |
63.5%
|
59.6%
|
86.1%
|
83.3%
|
83.3%
|
70.3%
|
| Canterbury/Westland |
54.9%
|
48.3%
|
71.4%
|
73.4%
|
73.4%
|
63.4%
|
| Central Otago Lakes |
81.6%
|
75.7%
|
123.3%
|
120.8%
|
120.8%
|
100.3%
|
| Otago |
43.4%
|
39.0%
|
60.4%
|
59.8%
|
59.8%
|
52.2%
|
| Southland |
37.4%
|
32.0%
|
51.0%
|
44.8%
|
44.8%
|
31.1%
|
Question and Answers about the report
How does interest.co.nz work out these numbers?
Interest.co.nz gathers data from Statistics New Zealand and IRD on wages in each region, data from the Real Estate Institute from each region each month, and data from banks and non-banks on interest rates. It has calculated home loan affordability going back to the beginning of 2002.
How is this survey different from the Massey University survey of affordability?
The Massey study is only done quarterly rather than monthly and uses an index of Home affordability rather than actually measuring home loan affordability. It uses an index rather than the actual measure of the proportion of after tax pay needed to service an 80% mortgage on a median home. The exact composition and meaning of the index is not detailed.
Why use a single median income rather than household income?
It’s true that most homebuyers are using a combination of one or more full or part time incomes to service their mortgage. Each household is different and may be using incomes from different sources. The best measure of average national household income is calculated officially once in every three years by Statistics New Zealand. Interest.co.nz chose to use the median income data series from IRD and Statistics NZ because it can be measured monthly and can be drilled down by region and by age.
We do include a chart showing how many median incomes are required to keep mortgage payments at 40% of take home pay. It is currently around 2 median incomes.
Why is home loan affordability important?
It is a useful way to work out if a housing market is overvalued. It’s clear house prices stopped rising when the national affordability ratio rose above 80% or 2 median incomes to service the average home loan. It’s a way of comparing affordability of housing markets with a national average and comparing housing values from one year to the next. For example, the affordability ratio in 2002 before the housing boom really took off was around 41%.
No chart with that title exists.

We welcome your comments below. If you are not already registered, please register to comment
Remember we welcome robust, respectful and insightful debate. We don't welcome abusive or defamatory comments and will de-register those repeatedly making such comments. Our current comment policy is here.