
By David Chaston
Information from the Budget shows how the tax burden is shared and how 'progressive' the tax system is.
Data released with Budget 2011 reveals that those on annual incomes of $100,000 and more - at least, those who declare their income at this level - will be paying 30% of all PAYE taxes in 2011/12, the highest share that this group has ever paid.
They make up just 4.9% of all taxpayers.
In fact, those declaring $150,000 or more – just 1.7% of taxpayers – will be paying 17% of all taxes, ten times more than an equal share
At the other end of the income range, those on $50,000 or less make up 75% of all taxpayers, and will be paying just 22% of the PAYE taxes, less than one third of an equal share.
Between these two groups, those between $50,000 and $100,000 per year will pay 39% of all PAYE, but these people make up only 20% of all individual taxpayers, twice an equal share.
Less is more?
It is a working proposition among some public policy analysts that a lower marginal tax rate generates a higher tax take.
The adoption of a top 39% rate in 2000 may have distorted how some top-rate taxpayers ‘organised their affairs’ but the growth in their share of tax collections grew from about 18% to 25% over a ten year period.
However, the reduction of that marginal tax rate to 33% last year will see their share rise to over 30% of all tax paid in only three years.
That will represent an additional $1 billion from that high-income group, the fastest rate of growth over the past ten years.
A closer inspection, focusing on the top 5% of taxpayers, the 'middle' 25%, and the bottom 70% - which both removes the bracket-creep aspect on one hand, and on the other reveals how distorted the income tax distribution has become – shows that a quarter of all taxpayers will pay almost half of all PAYE tax in 2011/12.
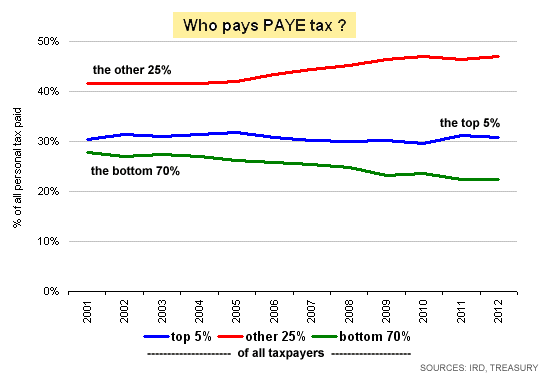
This analysis is broadly consistent with that published by the OECD earlier this month in an international survey of "Taxing Wages". That showed that in all eight senarios they monitored, New Zealand taxed wages at the lowest level in the OECD, or in the lowest four countries. The senarios they reviewed (1=lowest in OECD) were:
- single, no children, 67% of average wage = 4 out of 35 countries
- single, no children, average wage = 3
- single, no children, 167% of average wage = 4
- single, two children, 67% of average wage = 1
- married, two children, average wage = 1
- married, two children, 133% of average wage = 2
- married, two childgren, 167% of average wage = 2
- married, no children, 133% average wage = 3
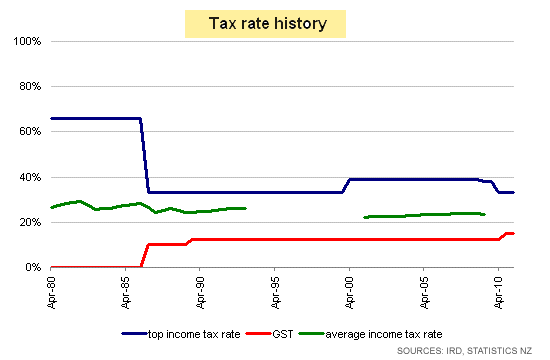
The cut in income tax rates in 2011 came as part of a 'bargain' that saw GST raised at the same time. It reinstated a trade-off that was sold to taxpayers first by the Lange government in 1986 - but one that was not offered when GST went to 12.5% in 1989, nor when the top marginal tax rate went to 39% in 2000. For the record, here is a chart of our tax rate history, to keep things in perspective.
We welcome your comments below. If you are not already registered, please register to comment
Remember we welcome robust, respectful and insightful debate. We don't welcome abusive or defamatory comments and will de-register those repeatedly making such comments. Our current comment policy is here.