
Here's my summary of the key events overnight that affect New Zealand, with news global manufacturers are bullish - except perhaps in the US and China.
But first, don't forget it is a public holiday in New York, so data flows from the US are few. However, there have been two factory PMI reports out, but they are not helpful. The highly respected ISM report said American factory activity rose sharply in June to its highest level in almost three years suggesting economic growth in the second quarter gained some steam. But the Markit PMI was much more downbeat, reporting the same sector had its slowest rise in production volumes since September 2016, and that new order growth eased for fifth month running. Take your pick.
The Caixin PMI report for China was also not very encouraging, but that was also in contrast to the official Chinese survey.
The equivalent survey in Australia was however very upbeat. As was Europe and Japan. These mirror our own PMI survey, (which may be the strongest of the lot), and all contribute to a global assessment of "global manufacturing growth solid and steady through second quarter", weighed down by the US, but upbeat most other key places.
In Hong Kong, China has launched its "Bond Connect" scheme that links China's US$9 tln bond market with overseas investors. Trading initially is "northbound", meaning foreign investors are now able to buy and sell Chinese bonds. No launch date has been set for the southbound channel. It is the latest step in Beijing's efforts to liberalise and strengthen their capital markets. In the first 20 minutes of trading, about US$300 mln in trades were done, mainly by HSBC and the Bank of China. Analysts reckon more than US$1 tln of additional global fixed income investments will be allocated to China domestic bonds over the next ten years. Watch your KiwiSaver managers.
Across the border from Hong Kong (pop: 7.3 mln) is the powerhouse southern city of Shenzhen (pop: 12 mln). And housing prices there are falling, and are now down more than -15% year-on-year. That realignment of price has brought higher sales volumes however, which are up by more than a quarter from the same month a year ago.
In Australia, the latest official data showed that Australian households owed debt in the March quarter equal to 190% of their yearly disposable income – a new all-time high. (The equivalent NZ level is 167%.)
International trading in US Treasuries has the UST 10yr yield up sharply again today and is now at 2.35%. These relentless rises are pressuring our swap rates and they are likely to rise again after that UST increase overnight. In fact, if this all passes through, we will have seen a +20 bps rise in the 2 year swap in a week, a +30 bps rise for the five year, and a +35 bps rise for the ten year. These are four month highs. If they keep going, we will be in 'significant', 'market turning' territory.
The price of oil is also higher today, rising to just under US$47 a barrel, while the Brent benchmark is now just on US$49.50.
But the price of gold is down very sharply, slumping more than -US$20 to just US$1,218/oz.
The Kiwi dollar has slipped slightly against the greenback, now at 73 USc. On the cross rates we are holding at 95.4 AU¢, and at 64.2 euro cents. The TWI-5 index is at 77.
If you want to catch up with all the changes yesterday, we have an update here.
The easiest place to stay up with event risk today is by following our Economic Calendar here ».
Daily exchange rates
Select chart tabs
4 Comments
I got an alert that silver dropped 2% and gold dropped 1.2%. It looks like there's a bit of a slide going on at the moment. Makes me wonder if there's a big push for collateral at the moment.
But first, don't forget it is a public holiday in New York, so data flows from the US are few
I think not - review calendar
These mirror our own PMI survey, (which may be the strongest of the lot), and all contribute to a global assessment of "global manufacturing growth solid and steady through second quarter", weighed down by the US, but upbeat most other key places.
Hmmmmm...
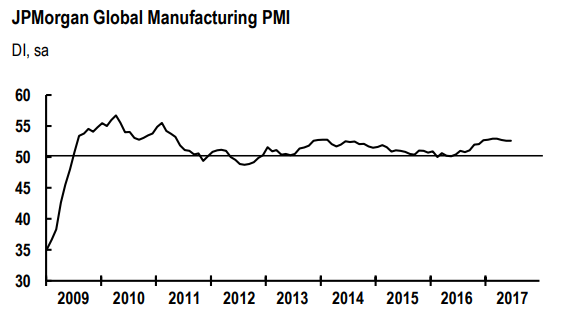
I believe the overall issue remains lack of actual growth, the repeating condition of mere positive numbers as opposed to meaningful expansion. The JP Morgan Global Manufacturing PMI illustrates this point quite well: view graphic image
Growth around the world is up but only slightly compared to last year; more like 2014 than 2010 or early 2011. Because of that, the underlying economic condition is not one of strength but continued unevenness. Some parts of the global economy are legitimately doing better than last year, but others are not. The result is what we find across global inflation figures as well as PMI’s, in general terms the same inability to strike up momentum.
It’s as if “something” continues to anchor and weigh down the global economy. Read more
Are there some QV or Barfoot numbers incoming soon?
We welcome your comments below. If you are not already registered, please register to comment
Remember we welcome robust, respectful and insightful debate. We don't welcome abusive or defamatory comments and will de-register those repeatedly making such comments. Our current comment policy is here.