
Here's my summary of the key events overnight that affect New Zealand, with news that bank lending for housing is still rising strongly in Australia.
Firstly however, in the US their housing market sales volumes bounced back in July, after three months of declines. But the jump in volumes only partially recovered what had been lost in that prior quarter. Listing numbers are down but prices are up. However, the level of investor interest has fallen to its lowest level in a year, said to be due to "less homes for sale at bargain prices".
A key midwest manufcaturing survey which is closely watched was a drag on sentiment today reversing a strong June result, but a similar survey in Texas was very upbeat.
In China, both of their official PMI readings slipped a little, indicating a moderation in their expansion. The factory index was back to the level it has averaged for the past nine months, and the services measure was back to the average for the past year. Neither is cause for concern, but equally, neither indicates growing momentum.
China is famous for an outsized trade surplus - in goods. But in services, it has a large deficit, and that grew sharply in June, up by about 30%. Still, the net between them is still a surplus of almost US$17 bln in the month. (Note: the Chinese got their decimal in the wrong place in the link.)
HSBC, which has undergone a shakeup and downsizing over the past few years, has reported bumper half year results - so good, it is using its extra cash flow to buy back its shares to pump up its share price.
In Europe, their jobless rate has fallen to an average of 9.1%. That is down a whole percentage point in a year. But that average masks a very wide range. It is 2.9% in the Czech Republic and a whopping 21.7% in Greece. However, the gains seem to be being made across most EU countries.
In Australia, the spot iron ore price surged overnight in response to supply concerns, especially by China.
And despite official attempts by regulators to quell strong lending growth for housing in Australia, the latest data shows that is hardly working. Others are rushing in to fill the gap and overall lending for housing is up +6.7% in a year. It is up almost +8% for banks other than the big four. Of particular note is that corporate lending by Chinese banks in Australia is up a remarkable +23% in a year.
In New York, the UST 10yr yield is unchanged at 2.29%.
The price of oil rose again today and is now at just over US$50 a barrel, while the Brent benchmark is now just over US$52.50.
The price of gold is unchanged but holding its higher level US$1,268/oz.
The Kiwi dollar will start just slightly softer at 75 USc. On the cross rates we marginally lower at 93.9 AU¢, and at 63.4 euro cents. As a result the TWI-5 index will start today at 77.3.
If you want to catch up with all the changes yesterday, we have an update here.
The easiest place to stay up with event risk today is by following our Economic Calendar here ».
Daily exchange rates
Select chart tabs
5 Comments
HSBC, which has undergone a shakeup and downsizing over the past few years, has reported bumper half year results - so good, it is using its extra cash flow to buy back its shares to pump up its share price.
I am not so sure one follows the other.
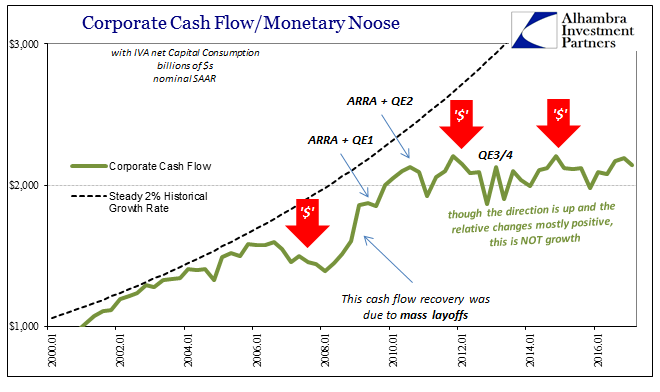
The only true increase in aggregate corporate cash flows over the last ten years was when businesses in the US were starting in November 2008 (when systemic liquidity was at its worst) for six months cutting an average of 700k jobs each and every month. It has been a lesson that stayed learned largely because monetary policy has done nothing to alleviate liquidity pressures (proven by more than just 2011), preferring instead the attempted manipulation of sentiment.
Spare cash is, from the view inside of boardrooms, better either hoarded or “invested” in share repurchases. Committing to expansion is under these circumstances (liquidity preferences) the highest risk scenario, meaning high risk and little expected return. Thus, the world remains stuck in liquidity preferences no matter what – at least until someone actually and directly addresses the real monetary problem. Read more
Inflation in Europe was in July 2017 once again underwhelming. Eurostat’s HICP inflation index grew at a 1.3% annual rate for the second straight month. Other than for February 2017, the inflation rate has been less than the ECB’s 2% target for four and a half years. During that time, Europe’s central bank has vastly expanded its liquidity facilities (twice) and its balance sheet (PSPP, or QE). Read more
In the first warning sign that the US Treasury is burning through more cash than previously expected, at 3pm today the Treasury Department announced that in its latest forecast of end-of-September cash balance it anticipated only $60 billion of cash on hand, nearly half the $115 billion it forecast in its previous report in May, according to the Department’s marketable borrowing estimates. The treasury also expects to borrow $96 billion in net marketable debt in the current quarter, down from $98 billion forecast previously.
This drawdown in cash, and jump in government outlays, was to be expected following the latest Monthly Statement from the Treasury which showed a surge in government outlays, which hit a record high $429 billion in June, for reasons discussed previously.
However, the second, and more troubling warning sign was that in its initial forecast of calendar Q4 marketable borrowing needs, the Treasury now expects a near record $501 billion in net marketable debt to be issued from October through December. This amount will be nearly equal to the actual marketable debt borrowed in the last 4 quarters, which amounts to $527 billion. The full sources and uses can be found here. Read more
Is Treasury addressing a collateral shortage?
The Aussie property Ponzi scheme appears to be totally out of control. This will be a spectacular crash, for sure.
No doubt the second tier lenders will explode at some point.
We welcome your comments below. If you are not already registered, please register to comment
Remember we welcome robust, respectful and insightful debate. We don't welcome abusive or defamatory comments and will de-register those repeatedly making such comments. Our current comment policy is here.