

By Gareth Vaughan
A new report on global debt levels features a "cutting-edge dataset" covering private and public debt for virtually the entire world dating back to the 1950s.
The report is an International Monetary Fund (IMF) working paper entitled Global Debt Database: Methodology and Sources.
Key findings from the paper include;
* Almost a decade after the collapse of Lehman Brothers, global debt, at US$164 trillion - or about 225% of global Gross Domestic Product - has reached new record highs.
* Global debt ratios have been on an almost uninterrupted ascending trend since World War II.
* The most indebted economies in the world are also the richer ones, with the top three borrowers - the United States, China, and Japan - accounting for more than half of global debt, which is significantly greater than their share of global output.
* The driving force behind global indebtedness has been the private sector, which has almost tripled its debt since 1950.
* Except for a short hiatus, no deleveraging has taken place at the global level since the onset of the Global Financial Crisis (GFC).
* Since the onset of the GFC in 2008, China accounts for almost three-quarters of the increase in global private debt.
* From a sectoral perspective, the driving force behind global indebtedness has been the private sector, which has almost tripled its debt since 1950.
'A new dataset that takes a fundamentally different approach to compiling historical debt data'
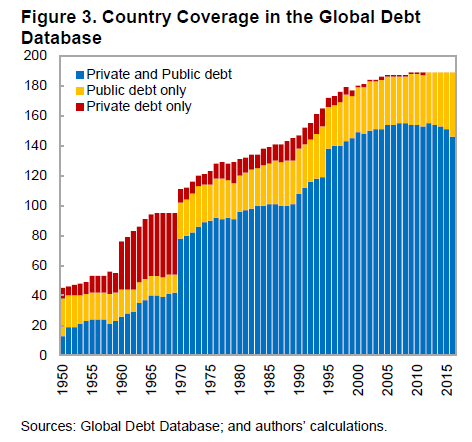
According to the paper's authors - Samba Mbaye, Marialuz Moreno Badia, and Kyungla Chae - their work describes the compilation of the Global Debt Database (GDD), a new dataset that takes a fundamentally different approach to compiling historical debt data. They say the GDD is the result of a multiyear investigative process and an extensive standardization effort to produce consistent time series of debt. It covers the debt of the nonfinancial sector, both private and public, for "virtually the entire world" being 190 countries including New Zealand, dating back to the 1950s.
The paper reports various measures of private debt ranging from core instruments such as loans and securities to total private sector debt liabilities, for both households and nonfinancial corporations, plus public debt from the central government to the wider public sector.
"One of the main benefits of this strategy is that it ensures the consistency of debt series throughout time. In addition, by including both the sovereign and private sides of borrowing, we can offer a global picture of total debt while accounting for the interlinkages between the public and private sector," the authors say.
"By including both the sovereign and private sides of borrowing for close to the entire universe of countries, we can offer a global picture of debt in the post-World War II era, which was not possible in previous studies."
Insights from this comprehensive database include that, almost 10 years after the collapse of Lehman Brothers, global debt, at US$164 trillion, or about 225% of global GDP, has reached new record highs. This figure includes government, household, and nonfinancial firm debt.
"Not surprisingly, the most indebted economies in the world are also the richer ones. It is nonetheless striking that the top three borrowers in the world [being] the United States, China, and Japan, account for more than half of the global debt, significantly greater than their share of global output."
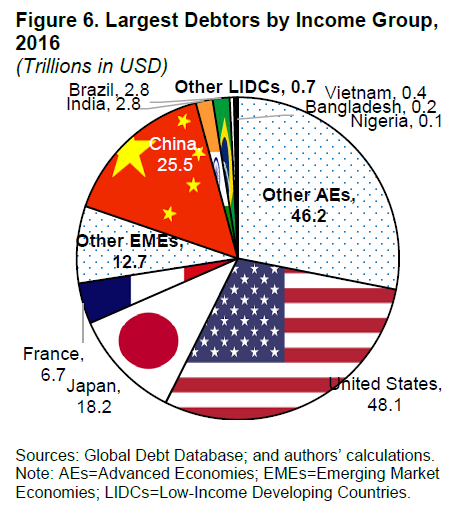
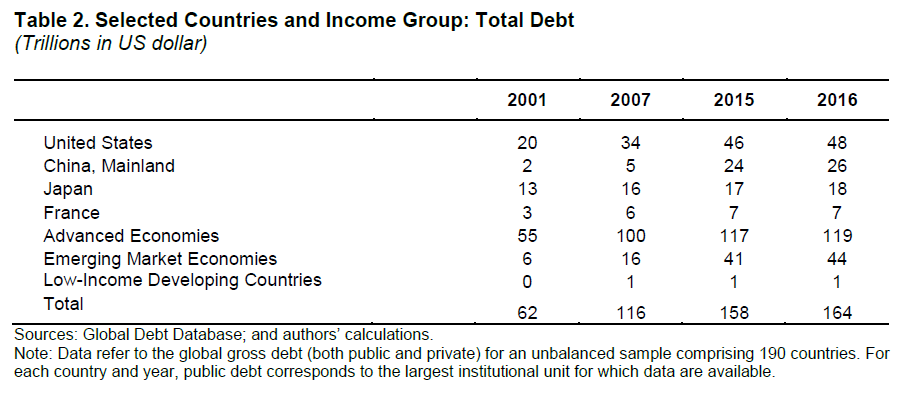
The authors point out the emergence of China among the most indebted countries is quite a new development. That's because since the beginning of the millennium, China’s share of global debt has surged from less than 3% to more than 15%.
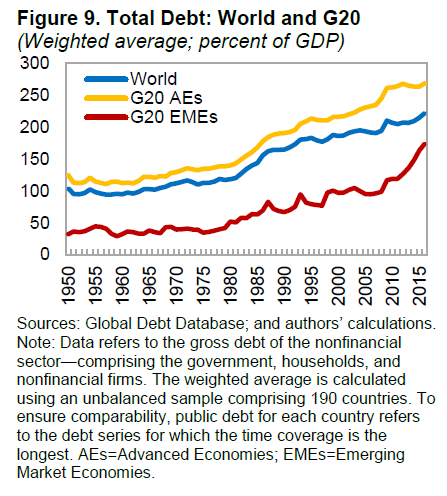
Meanwhile, compared to the previous peak in 2009, global debt is now 12% of GDP higher.
"That is, except for a short hiatus, no deleveraging has taken place at the global level since the onset of the GFC," the paper says. "This reflects an increase in both public and private nonfinancial debt but different country groups are behind these trends. Public debt increases have been mainly driven by advanced economies while the private debt surge is mainly explained by emerging market economies."
A longer-term view shows global debt ratios have been rising almost uninterrupted since World War II. Since the GFC, emerging market economies have taken the lead.
Low income countries account for less than 1% of global debt, well below their share of output.
Private sector almost triples debt since 1950
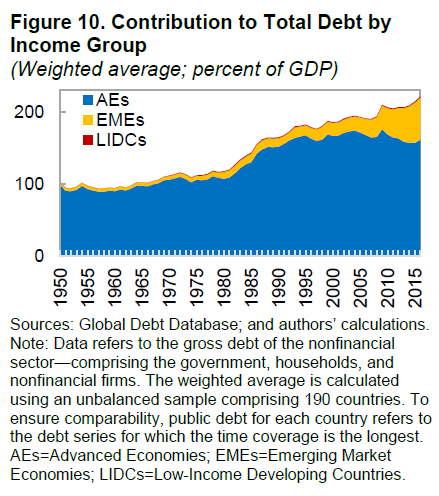
From a sectoral perspective, the authors say the key driving force behind global indebtedness has been the private sector, which has almost tripled its debt since 1950.
"The global leverage cycle was dominated by advanced economies for almost six decades, with the debt of the nonfinancial private sector reaching a peak of 170% of GDP in 2009 and little deleveraging since. On the other hand, the ascent of emerging market economies is a relatively new development, which started to accelerate only in 2005. But by 2009, emerging market economies have become the major force behind global trends. Private debt ratios doubled in a decade, reaching 120% of GDP by 2016," the paper says.
"Developments since the onset of the GFC are, however, almost match one-to-one trends in just one country. China alone accounts for almost three-quarters of the increase in global private debt. At the other end of the spectrum, financial deepening in low-income developing countries has been limited."
In terms of public debt, advanced economies have experienced a continuous increase, aside from a short interruption just before the GFC due to to favorable cyclical conditions. And although public debt ratios have reached a plateau during recent years, at more than 100% of GDP, they still exceed the levels seen in the early 1950s.
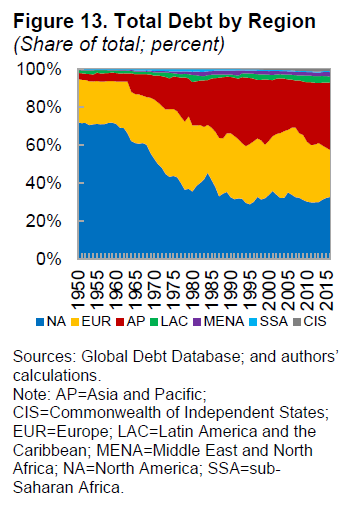
In terms of regions of the world, the most indebted ones are the Asia Pacific, North America, and Europe. In 2016 they accounted for 35%, 33%, and 25% of global debt, respectively.
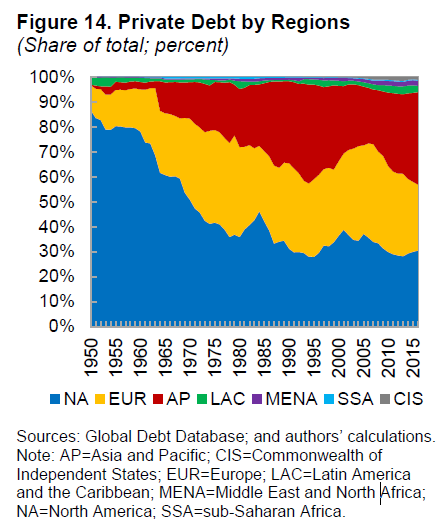
"Since the early 1950s, North America was at the lead of the global debt ranking but was taken over by Asia Pacific in the early 1990s, partly due to rapid leveraging in Japan. Nonetheless, North America regained the top ranking at the turn of century and maintained it until the onset of the GFC. Since then, the Asian and Pacific Region has returned to the top position, this time thanks to the rapid credit increase in China. The ranking among the top three regions on private debt are pretty much the same, although the share of private debt from other regions is even smaller than total debt, reflecting lower levels of financial deepening in less developed countries."
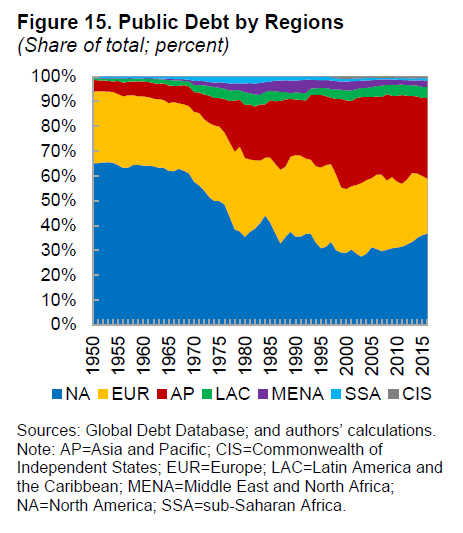
"Interestingly, the ranking on public debt has been similar to those of total and private debt until 2013. Since then, and unlike total and private debt, North America has been the highest debtor in the world among public borrowers," the paper says.
The IMF says views expressed in IMF working papers are those of the authors and don't necessarily represent IMF views.
*This article was first published in our email for paying subscribers early on Thursday morning. See here for more details and how to subscribe.
We welcome your comments below. If you are not already registered, please register to comment
Remember we welcome robust, respectful and insightful debate. We don't welcome abusive or defamatory comments and will de-register those repeatedly making such comments. Our current comment policy is here.