

By Rodney Dickens
The ANZ economists have done a good job running the business survey twice monthly since March last year. This helps assess the impact of Covid-19 changes like the latest tightening. The preliminary February survey was conducted before the change in Covid-19 levels while the final survey for February to be released near the end of the month will provide a useful comparison, especially if the tightening of the levels lasts beyond Wednesday.
This is in the context of the survey having some quite big shortcomings I have identified previously. The survey should be useful at showing the marginal impact of things like changes in Covid-19 levels, but you still need to be wary of interpreting most of the survey’s components at face value. This wouldn’t be such an issue if ANZ’s economists qualified insights provided by the survey, like the huge political bias in most components, but they don’t, so I do.
Putting some key components of the ANZ business survey in context so you can get more useful insights from the survey
I complement the ANZ economists for providing some useful add-ons to the survey in addition to running it twice monthly. For example, the December survey provided some useful insights into how firms in different industries are feeling the impact of freight disruptions and a useful breakdown of the factors most challenging firms. In the preliminary February survey there were some useful insights about inflation pressures.
However, this doesn’t identify the shortcomings that need to be taken into account before it is possible to interpret what the results of the survey really mean.
The own activity component has a history of bias that started in 2002 when the Helen Clark government introduced some business-unfriendly policies, like a big increase in ACC levies. As a result, it generally ran below the level it should during most of the Clark era, just to rebound to higher levels than justified by economic growth when the John Key government came to power, while it returned to having a negative bias when the Jacinda Ardern government won the late-2017 election (chart below). The political bias can be measured by the gap between the survey that is advanced or shifted to the right by two quarters as a leading indicator (right scale) and annual GDP growth (left scale). The survey and GDP growth fell simultaneously as a result of the major lockdown last year, but in time the two-quarter lead should return.
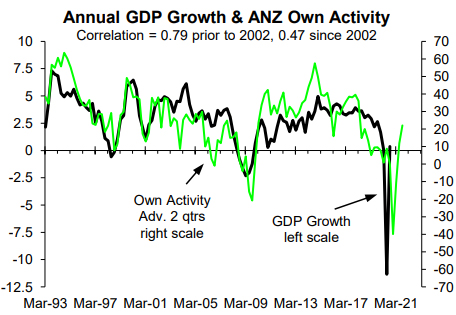
The problem in interpreting the rebound in the survey since the lockdown last year and the current level is that it isn’t possible to say how much of it was due to the end of the lockdown vs. some reduction in the negative political bias. The previous chart points to a bias of around -20-30%. If the bias hasn’t fallen the bias-adjusted level of the survey would be in the ballpark of 40-50% net positive vs. the most recent actual level of 22% net positive. One implies near-term GDP growth of around 2.5% and the other nearer to 5%. This issue is clarified in our monthly economic report.
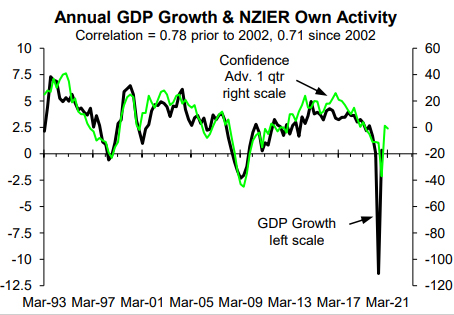
The NZIER own activity survey has been much less subject to political bias, possibly because it gets less media attention. The downfall of the ANZ survey in terms of the political bias many of its components have will be largely a by-product of its success in getting media coverage; making it an obvious target for firms wanting to use it to send a message to the government of the day. The NZIER survey was subject to positive bias prior to 2017. Of more concern is how little it fell as a result of the first major lockdown, meaning it is hard to say with confidence whether the latest reading can be interpreted at face value (i.e. around 2.5% GDP growth). But it is likely to be much less wayward than the ANZ survey. This is a shame because the ANZ survey is monthly (bi-monthly now) vs. quarterly for the NZIER survey.
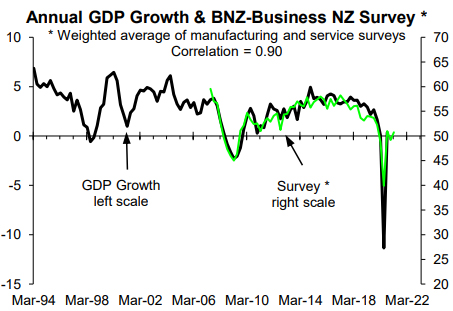
The BNZ-Business NZ surveys appear to have little political bias but doesn’t lead at all (next chart).
ANZ’s employment intentions survey has the same shortcoming (next above). After Labour won in late-2017 it developed a sizeable negative bias. If this bias is still there the rebound in the survey since the lockdown is even more impressive, but a part of the reason for the scale of the rebound could be the bias shrinking as a result of abating anti-government sentiment among some respondents of the survey.
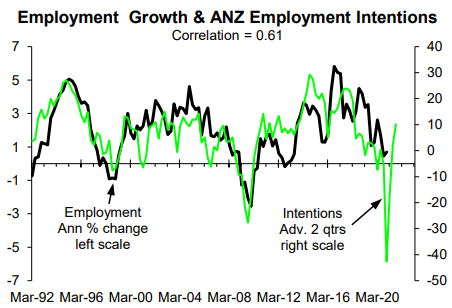
The latest reading of the employment survey points to annual employment growth of close to 3% by the September quarter; the best fit is with the survey advanced or leading by two quarters. However, if the survey still has significant political bias and this is removed, it could be pointing to employment growth surging to 4%+. The only way of finding out if the political bias has fallen is asking respondents, but in the unlikely event this is done the results would have to be interpreted with caution because respondents are likely to admit to trying to use the ANZ survey to try and manipulate public opinion.
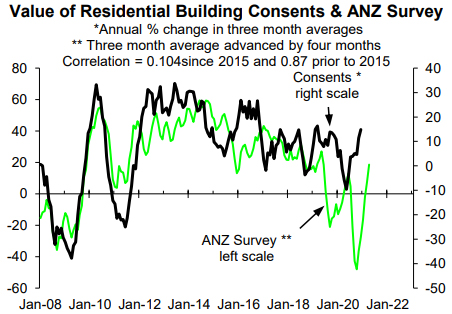
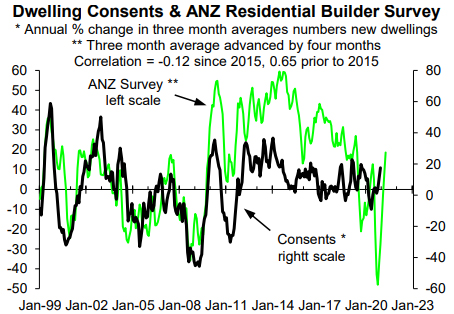
The ANZ residential builders survey used to provide useful insights into near-term prospects for annual growth in the value and number of consents for new dwellings, but this stopped being the case some time ago (next two charts). In the case of this component, it looks to be plain unhelpful for assessing building prospects as I have been pointing out to clients of our building reports for some time.
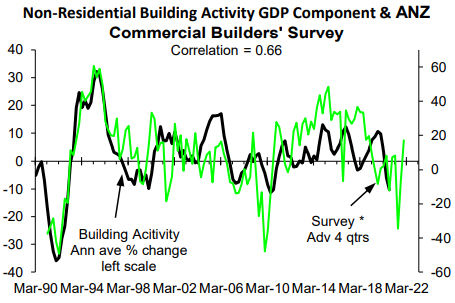
It is similar with the commercial builders survey in that it was once quite useful in assessing near-term prospects for annual growth in non-residential building activity, but it is as often wrong about even the direction than right these days (next chart).
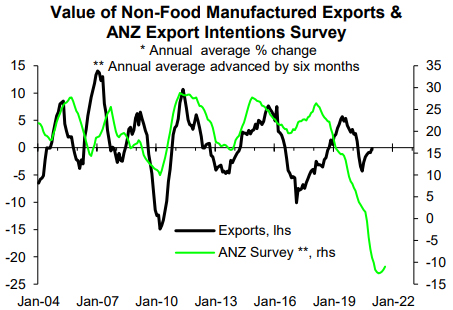
In terms of assessing the impact of global Covid-19 developments on exporters, the ANZ export survey should be useful. But despite claims by the ANZ economists it is, it clearly isn’t as is shown in the next chart that compares it with annual growth in the value of non-food manufactured exports (something the ANZ economists suggest the survey is useful for assessing near-term prospects)
This article is here with permission.
1 Comments
Rodney does the NZIER survey now include the dominating agriculture and primary industry sectors?
"Whilst on the surface the survey result suggests lower economic growth ahead, in reality this survey has been a poor predictor of NZ’s actual GDP growth as it is not representative of the total economy. For unexplained reasons NZIER fail to survey the dominating agriculture and primary industry sectors."
https://www.interest.co.nz/currencies/100580/roger-j-kerr-says-strong-u…
We welcome your comments below. If you are not already registered, please register to comment
Remember we welcome robust, respectful and insightful debate. We don't welcome abusive or defamatory comments and will de-register those repeatedly making such comments. Our current comment policy is here.